Uncovering Real-Time Bugs with Specialized RTOS Tools - Part 1
May 13, 2019
Blog

In this paper, we will look at tools specifically designed to help RTOS-based application developers uncover some elusive bugs, identify issues and offer corrective actions.
More and more embedded systems rely on the use of Real-Time Operating Systems (RTOSs) to: satisfy real-time requirements, reduce time-to-market, simplify development, increase code portability, and simplify development. Despite its many benefits, an RTOS also has its drawbacks, one of which is the possibility of introducing improperly assigned task priorities, stack overflows, starvation, deadlocks, priority inversions and other hard-to-find bugs.
In this paper, we will look at tools specifically designed to help RTOS-based application developers uncover some of these elusive bugs, identify issues and offer corrective actions. These tools are readily available yet often unknown to embedded developers.
What is an RTOS?
A real-time operating system (a.k.a. an RTOS or real-time kernel) is software that manages the time of a CPU (Central Processing Unit) as efficiently as possible. Most kernels are written in C and require a small portion of code written in assembly language in order to adapt the kernel to different CPU architectures. When you design an application (your code) with an RTOS kernel, you simply split the work into tasks, each responsible for a portion of the job. A task (also called a thread) is a simple program that thinks it has the CPU completely to itself. On a single CPU, only one task can execute at any given time. Your application code also needs to assign a priority to each task based on the task importance as well as a stack (RAM) for each task. In general, adding low-priority tasks will not affect the responsiveness of a system to higher-priority tasks. A task is also typically implemented as an infinite loop. The kernel is responsible for the management of tasks. This is called multitasking. Multitasking is the process of scheduling and switching the CPU between several sequential tasks. Multitasking provides the illusion of having multiple CPUs and maximizes the use of the CPU, as shown below. Multitasking also helps in the creation of modular applications. With a realtime kernel, application programs are easier to design and maintain.
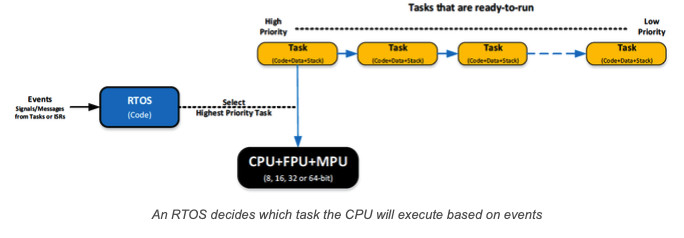
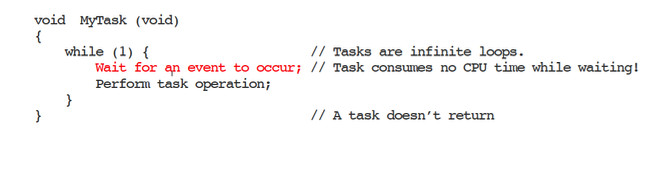
Most commercial RTOSs are preemptive, which means that the kernel always runs the most important task that is ready-to-run. Preemptive kernels are also event driven, which means that tasks are designed to wait for events to occur in order to execute. If the event that the task is waiting for does not occur, the kernel runs other tasks. Waiting tasks consume zero CPU time. Signaling and waiting for events is accomplished through kernel Application Programming Interfaces (API) calls. Kernels allow you to avoid polling loops, which would be a poor use of the CPU’s time. Below is an example of how a typical task is implemented:
A kernel provides many useful services to a programmer, such as multitasking, interrupt management, inter-task communication and signaling, resource management, time management, memory partition management and more. An RTOS can be used in simple applications where there are only a handful of tasks, but it is a must-have tool in applications that require complex and time-consuming communication stacks, such as TCP/IP, USB (host and/or device), CAN, Bluetooth, Zigbee and more. An RTOS is also highly recommended whenever an application needs a file system to store and retrieve data as well as when a product is equipped with some sort of graphical display (black and white, grayscale or color).
Built-In Debug Port
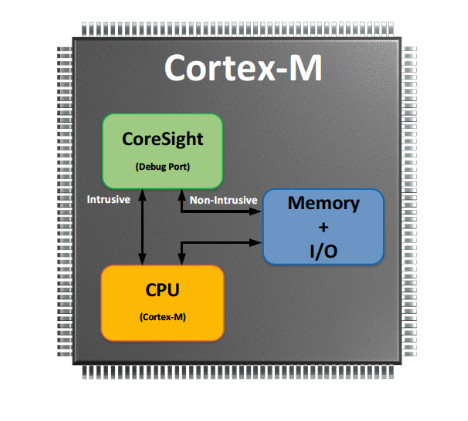
ARM Cortex.-M processors are equipped with special and very powerful debug hardware built onto each chip. CoreSight provides non-intrusive capabilities that allow tools to monitor and control live systems without halting the CPU such as:
- On the fly memory/peripheral access (Read and Write)
- Instruction Trace (requires that the chip also include an Execution Trace Macrocell, ETM)
- Data Trace
- Profiling using profiling counters
The figure below shows a simplified block diagram of the relationship between the CoreSight debug port, the CPU and Memory/Peripherals.
Tools for Testing/Debugging Live Systems
The diagram below shows how CoreSight connects to your development environment:
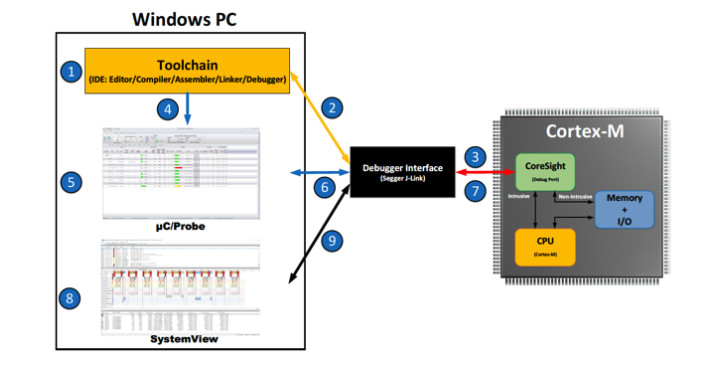
1 - Embedded developers often use an Integrated Development Environment (IDE) that includes a code editor, compiler, assembler, linker, debugger and possibly other tools.
Debuggers built into the IDE only provide the bare necessities: download code, start/stop, setup breakpoints and a few other simple features. Some debuggers go a step further and allow you to display and change variables while the target is running (a.k.a. Live Watch), but the capabilities are limited to numeric values. It’s also not uncommon for debuggers to include built-in RTOS awareness, but those typically require that you halt the application to examine the state of the RTOS (not very practical for debugging live systems).
2 - When you are ready to debug your application, download your code to the target through a Debugger Probe, such as the Segger J-Link [2].
3 - J-Link connects to the CoreSight debug port and is able to start/stop the CPU, download code, program the onboard Flash, and more. J-Link can also read and write directly to memory as needed even while the target is executing code.
4 - Micrium’s μC/Probe [3] is a standalone, CPU vendor-agnostic, Windows-based application that reads the ELF file produced by the toolchain. The ELF file contains the code that was downloaded to the target as well as the names of all globally accessible variables, their data types and their physical memory locations in the target memory.
5 - μC/Probe allows a user to display or change the value at run-time (i.e., live) of virtually any variable or memory location (including I/O ports) on a connected embedded target. The user simply populates μC/Probe’s graphical environment from a library of gauges, numeric indicators, tables, graphs, virtual LEDs, bar graphs, sliders, switches, push buttons and other components, and associates each of these with variables or memory locations in their embedded device. μC/Probe doesn’t require you to instrument the target code in order to display or change variables at run time. By adding virtual sliders or switches to μC/Probe’s screens, you can easily change parameters of your running system (such as filter coefficients and PID loop gains) or actuate devices and test I/O ports.
6 - μC/Probe sends requests to J-Link to read from or write to memory.
7 - J-Link requests are converted to CoreSight commands to obtain and display the value of variables graphically onto μC/Probe’s screens.
8 - Another highly useful tool for testing/debugging live embedded systems is SEGGER’s SystemView [4]. This tool typically works in conjunction with an RTOS and displays the execution profile of your tasks and ISRs on a timeline so you can view how long each task takes to execute (minimum/average/maximum), when tasks are ready-to-run, when execution actually starts for each task, when ISRs execute and much more. SystemView can help you uncover bugs that might go unnoticed, possibly for years. However, SystemView requires that you add code to your target (freely provided by SEGGER) that records RTOS events and ISRs. SystemView also consumes a small amount of RAM to buffer these events.
9 - J-Link allows multiple processes to access CoreSight concurrently, so you can use all three tools at once.
This blog is part 1 in a three-part series, to read part 2, click here.