Using Software to Find Hardware Bugs
August 27, 2018
Blog

If you?re unlucky enough that the software uncovers a bug after you?ve made chips, then what happens next depends on the severity of the problem.
This is part two of a series. Read part one here.
There’s a basic law of nature that applies to any computing chip, whether a processor, microcontroller, or system-on-chip: software always uncovers hardware bugs. In my entire career, there’s not one project I’ve been involved with where this hasn’t proven to be true.
If you’re unlucky enough that the software uncovers a bug after you’ve made chips, then what happens next depends on the severity of the problem.
- If it’s not deadly, and if you’re lucky and have market power like some well-known processor makers, then everyone codes around the bug, and then all future versions must replicate that bug for backwards compatibility. This doesn’t apply to most of us. More likely:
- You may have to drop a feature that isn’t working.
- Power may be too high, or performance too slow, hurting your competitiveness and ability to get a good price.
- In the worst case, you may have to pony up big time and spin another set of masks. Extra delays and costs.
The best solution is to run that software and catch those bugs before you commit to silicon. You’ll be verifying software and hardware at the same time. But how to do that?
Simulating software is excruciatingly slow. We’re talking years. Simply not an option for anything more than trivial code.
Emulation, by contrast, is proving to be a critical tool for solving this problem. You can instantiate the hardware on the emulator and then have it run actual code in a reasonable timeframe. Not real system speed, perhaps, but fast enough to make this a workable solution.
But, assuming you’re going to find issues, you have to be able to track down the causes of those issues, and it’s that debug part that’s historically been the catch. In fact, many engineers have been reluctant to use emulation because, in the past, the only access to the internal processor state was through JTAG. Emulators run at few-MHz clock speeds; JTAG on an emulator runs at a fraction of that.
So, for instance, if you want to single-step an instruction? That means the transfer of around 4 million low-level bits through JTAG. Done at 1 MHz on an emulator, that would take 4 seconds of very expensive live emulator time.
And, even worse, it’s intrusive: during those 4 seconds, the clock is working away. The processor state will stay fixed, but the world outside the processor will carry on. If you're just debugging processor code, this can work (even if slow). But if you're trying to debug interaction with non-processor hardware that becomes really tough, because all the stuff outside the processor has changed state by the time you've completed that single step.
With JTAG on an emulator being both slow and intrusive, debug – especially for performance- and synchronization-related issues – becomes very frustrating. And so, with this in mind, emulation hasn’t been the go-to solution in the past – and resistance remains.
Today’s Emulator Debug is Fast
But times and emulators have changed. Mentor has a separate way of capturing the processor state that doesn’t rely on JTAG, and so it can happen fast – in the 40-50 MHz range. Which might be even faster than JTAG on an FPGA prototype. The data is fed to our CoModel host, where the state history can be stored and recreated, cycle by cycle.
Given that stored trace, you can now replay any offending software against the trace, and it will follow the system state so that you can see where things go wrong. You can single-step; you can probe registers and memory; you can watch the busses. All without intrusion: your debug efforts aren’t changing the system state. And this can all be done offline – you don’t need to be on a live emulator, making it much more cost-effective.
So the historical concerns about whether software debug is practical on emulators no longer apply. You can exercise your computing platform thoroughly before tape-out. And software developers can shift sharply to the left to begin software development long before silicon availability and even before FPGA prototypes are available. And the tools available for debugging are designed to be familiar to software engineers – even if you end up uncovering a hardware bug.
Exercising Partial Systems
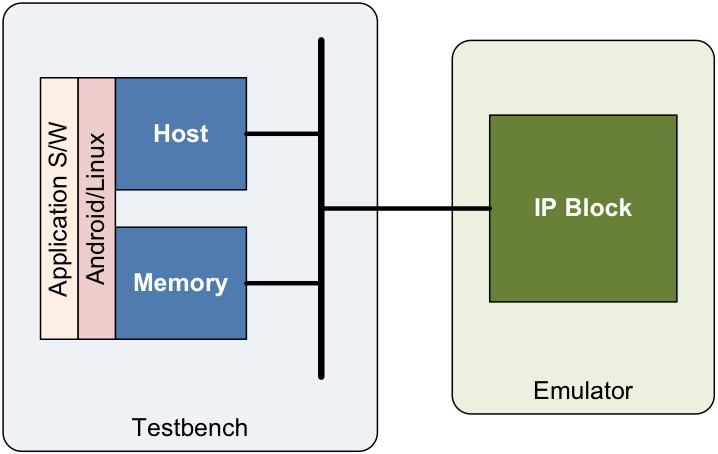
The next challenge we’re addressing is one that affects developers of individual blocks of IP that will ultimately be a part of the overall system. The trouble today is that you really can’t run your block through all of its paces with real software until full system integration, because the system needs your piece and all the other pieces to work. So even if you get your block design done early, it’s “hurry up and wait.”
At Mentor, we’re working on a testbench enhancement that will supply the critical parts of a computing platform. We’ll start with the ARM architecture and ARM-related busses, given ARM’s prevalence. The processor will be overlaid with Android or Linux. This will let you implement your block on the emulator and “plug it into” the abstracted environment in advance of the full system design being available, giving you a head start on verification.
We’re working with lead customers now on this feature, so stay tuned for more general availability.
In summary, then, you must run software before you generate masks in order to prove that your computing hardware is correct. Emulation is the only realistic way to do this, and the tools available today on Mentor’s Veloce emulators make this a very practical, productive exercise. You can debug your software and hardware quickly and with a minimum of live emulation time. And, in the not-too-distant future, you’ll be able to run and debug that software on IP blocks in advance of full system integration.
You can write your software earlier, and you can verify your hardware sooner. All of which makes it so much less likely that you’ll find those hardware bugs in real silicon.
Russ Klein, HLS Platform Program Director Mentor, a Siemens Business
Russell Klein is a program director in the Calypto division at Mentor, a Siemens Business. He holds a number of patents for EDA tools in the area of SoC design and verification. Mr. Klein has over 20 years of experience developing design and debug solutions, which span the boundary between hardware and software. He has held various engineering and management positions at several EDA companies.
Mentor, A Siemens Business