Making Sense of Sounds: How AI Can Boost Your Machine Uptime
November 12, 2019
Blog
A machine health monitoring system enables "computer hearing," which allows a computer to make sense of leading indicators of a machine?s behavior: sound and vibration.
Analog Devices has built a system, OtoSense, that is able to learn sounds and vibrations from a machine and decipher their meaning to detect abnormal behavior and to perform diagnostics. The system is a machine health monitoring system that enables what we call "computer hearing," which allows a computer to make sense of leading indicators of a machine’s behavior: sound and vibration.
This system applies to any machine and works in real time with no network connection. The system is adapted for industrial applications and enables scalable, efficient machine health monitoring .
The Human Hearing System and Translation to OtoSense
The process by which humans make sense of sounds can be described in four familiar steps: analog acquisition of the sound, digital conversion, feature extraction, and interpretation. Hearing with the human ear can be compared with the OtoSense system in these steps.
- Analog Acquisition and Digitization: In OtoSense, analog acquisition and digitization is performed by sensors, amplifiers, and codecs. The digitization process uses a fixed sample rate adjustable between 250 Hz and 196 kHz, with the waveform being coded on 16 bits and stored on buffers that range from 128 samples to 4096 samples.
- Feature Extraction: OtoSense uses a time window that we call chunk, which moves with a fixed step size. The size and step of this chunk can range from 23 ms to 3 s, depending on the events that need to be recognized, and the sample rate, with features being extracted at the edge. We’ll provide more information on the features extracted by OtoSense later on.
- Interpretation Happens in the Associative Cortex: OtoSense interaction with people starts from visual, unsupervised sound mapping based on human neurology. It shows a graphical representation of all the sounds or vibrations heard, organized by similarity, but without trying to create rigid categories. This allows experts to organize and name the groupings seen on screen without trying to artificially create bounded categories. They can build a semantic map aligned with their knowledge, perceptions, and expectations regarding the final output of OtoSense.
From Sound and Vibration to Features
A feature is assigned an individual number to describe a given attribute or quality of a sound or vibration over a period of time (the time window, or chunk, as we mentioned earlier). The OtoSense platform’s principles for choosing a feature are as follows:
- Features should describe the environment as completely as possible and with as many details as possible, both in the frequency domain and time domain. They have to describe stationary hums as well as clicks, rattles, squeaks, and any kind of transient instability.
- Features should constitute a set as orthogonally as possible. If one feature is defined as “the average amplitude on the chunk,” there should not be another feature strongly correlated with it, as a feature such as “total spectral energy on the chunk” would be. Of course, orthogonality is never reached, but no feature should be expressed as a combination of the others – some singular information must be contained in each feature.
- Features should minimize computation. Most OtoSense features have been designed to be incremental so that each new sample modifies the feature with a simple operation, with no need for recomputing it on a full buffer or, worse, chunk. Minimizing computation also implies not caring about standard physical units. For example, there is no point in trying to represent intensities with a value in dBA. If there is a need to output a dBA value, it can be done at the time of output, if necessary.
A portion of the OtoSense platform’s two to 1024 features describe the time domain. They are extracted either right from the waveform or from the evolution of any other feature over the chunk. Some of these features include the average and maximal amplitude, complexity derived from the linear length of the waveform, amplitude variation, the existence and characterization of impulsions, stability as the resemblance between the first and last buffer, skinny autocorrelation avoiding convolution, or variations of the main spectral peaks.
The features used on the frequency domain are extracted from an FFT. The FFT is computed on each buffer and yields 128 to 2048 individual frequency contributions. The process then creates a vector with the desired number of dimensions — much smaller than the FFT size, of course, but that still extensively describe the environment. OtoSense initially starts with an agnostic method for creating equal-sized buckets on the log spectrum. Then, depending on the environment and the events to be identified, these buckets adapt to focus on areas of the spectrum where information density is high, either from an unsupervised perspective that maximizes entropy or from a semi-supervised perspective that uses labeled events as a guide. This mimics the architecture of our inner ear cells, which is denser where the speech information is maximal.
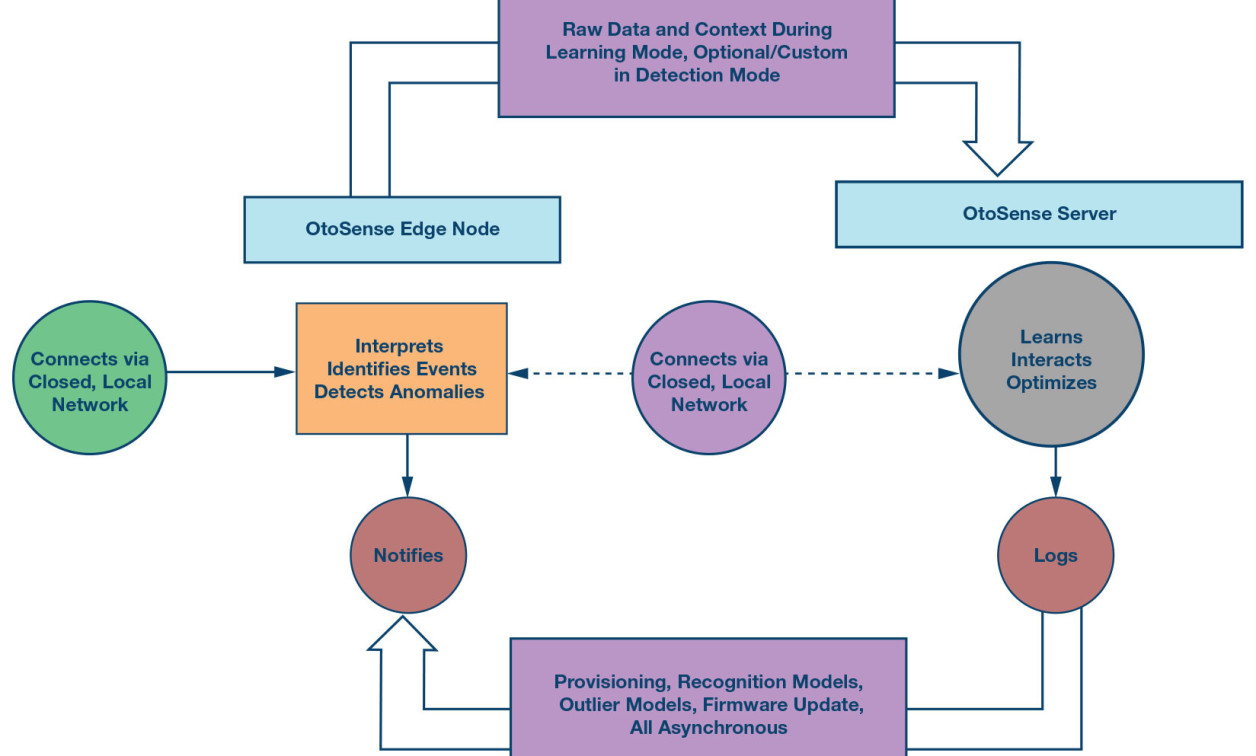
Architecture: Power to the Edge and Data on Premises
Outlier detection and event recognition with OtoSense happen at the edge, without the participation of any remote asset. This architecture ensures that the system won’t be impacted by a network failure and it avoids having to send all raw data chunks out for analysis. An edge device running OtoSense is a self-contained system describing the behavior of the machine it’s listening to in real time.
The OtoSense server, running the AI and HMI, is typically hosted on premises. A cloud architecture makes sense for aggregating multiple meaningful data streams as the output of OtoSense devices. It makes less sense to use cloud hosting for an AI dedicated to processing large amounts of data and interacting with hundreds of devices on a single site.


From Features to Anomaly Detection
Normality/abnormality evaluation does not require much interaction with experts to be started. Experts only need to help establish a baseline for a machine’s normal sounds and vibrations. This baseline is then translated into an outlier model on the OtoSense server before being pushed to the device.
Two different strategies are used to evaluate the normality of an incoming sound or vibration:
The first strategy is what we call usualness, where any new incoming sound that lands in the feature space is checked for its surrounding, how far it is from baseline points and clusters, and how big those clusters are. The bigger the distance and the smaller the clusters, the more unusual the new sound is and the higher its outlier score is. When this outlier score is above a threshold as defined by experts, the corresponding chunk is labelled unusual and sent to the server to become available for experts.
The second strategy is very simple: any incoming chunk with a feature value above or below the maximum or minimum of all the features defining the baseline is labeled as extreme and sent to the server as well.
The combination of unusual and extreme strategies offers good coverage of abnormal sounds or vibrations, and these strategies perform well for detecting progressive wear and unexpected, brutal events.
From Features to Event Recognition
Features belong to the physical realm, while meaning belongs to human cognition. To associate features with meaning, interaction between OtoSense AI and human experts is needed. A lot of time has been spent following our customers’ feedback to develop a human-machine interface (HMI) that enables engineers to efficiently interact with OtoSense to design event recognition models. This HMI allows for exploring data, labeling it, creating outlier models and sound recognition models, and testing those models.
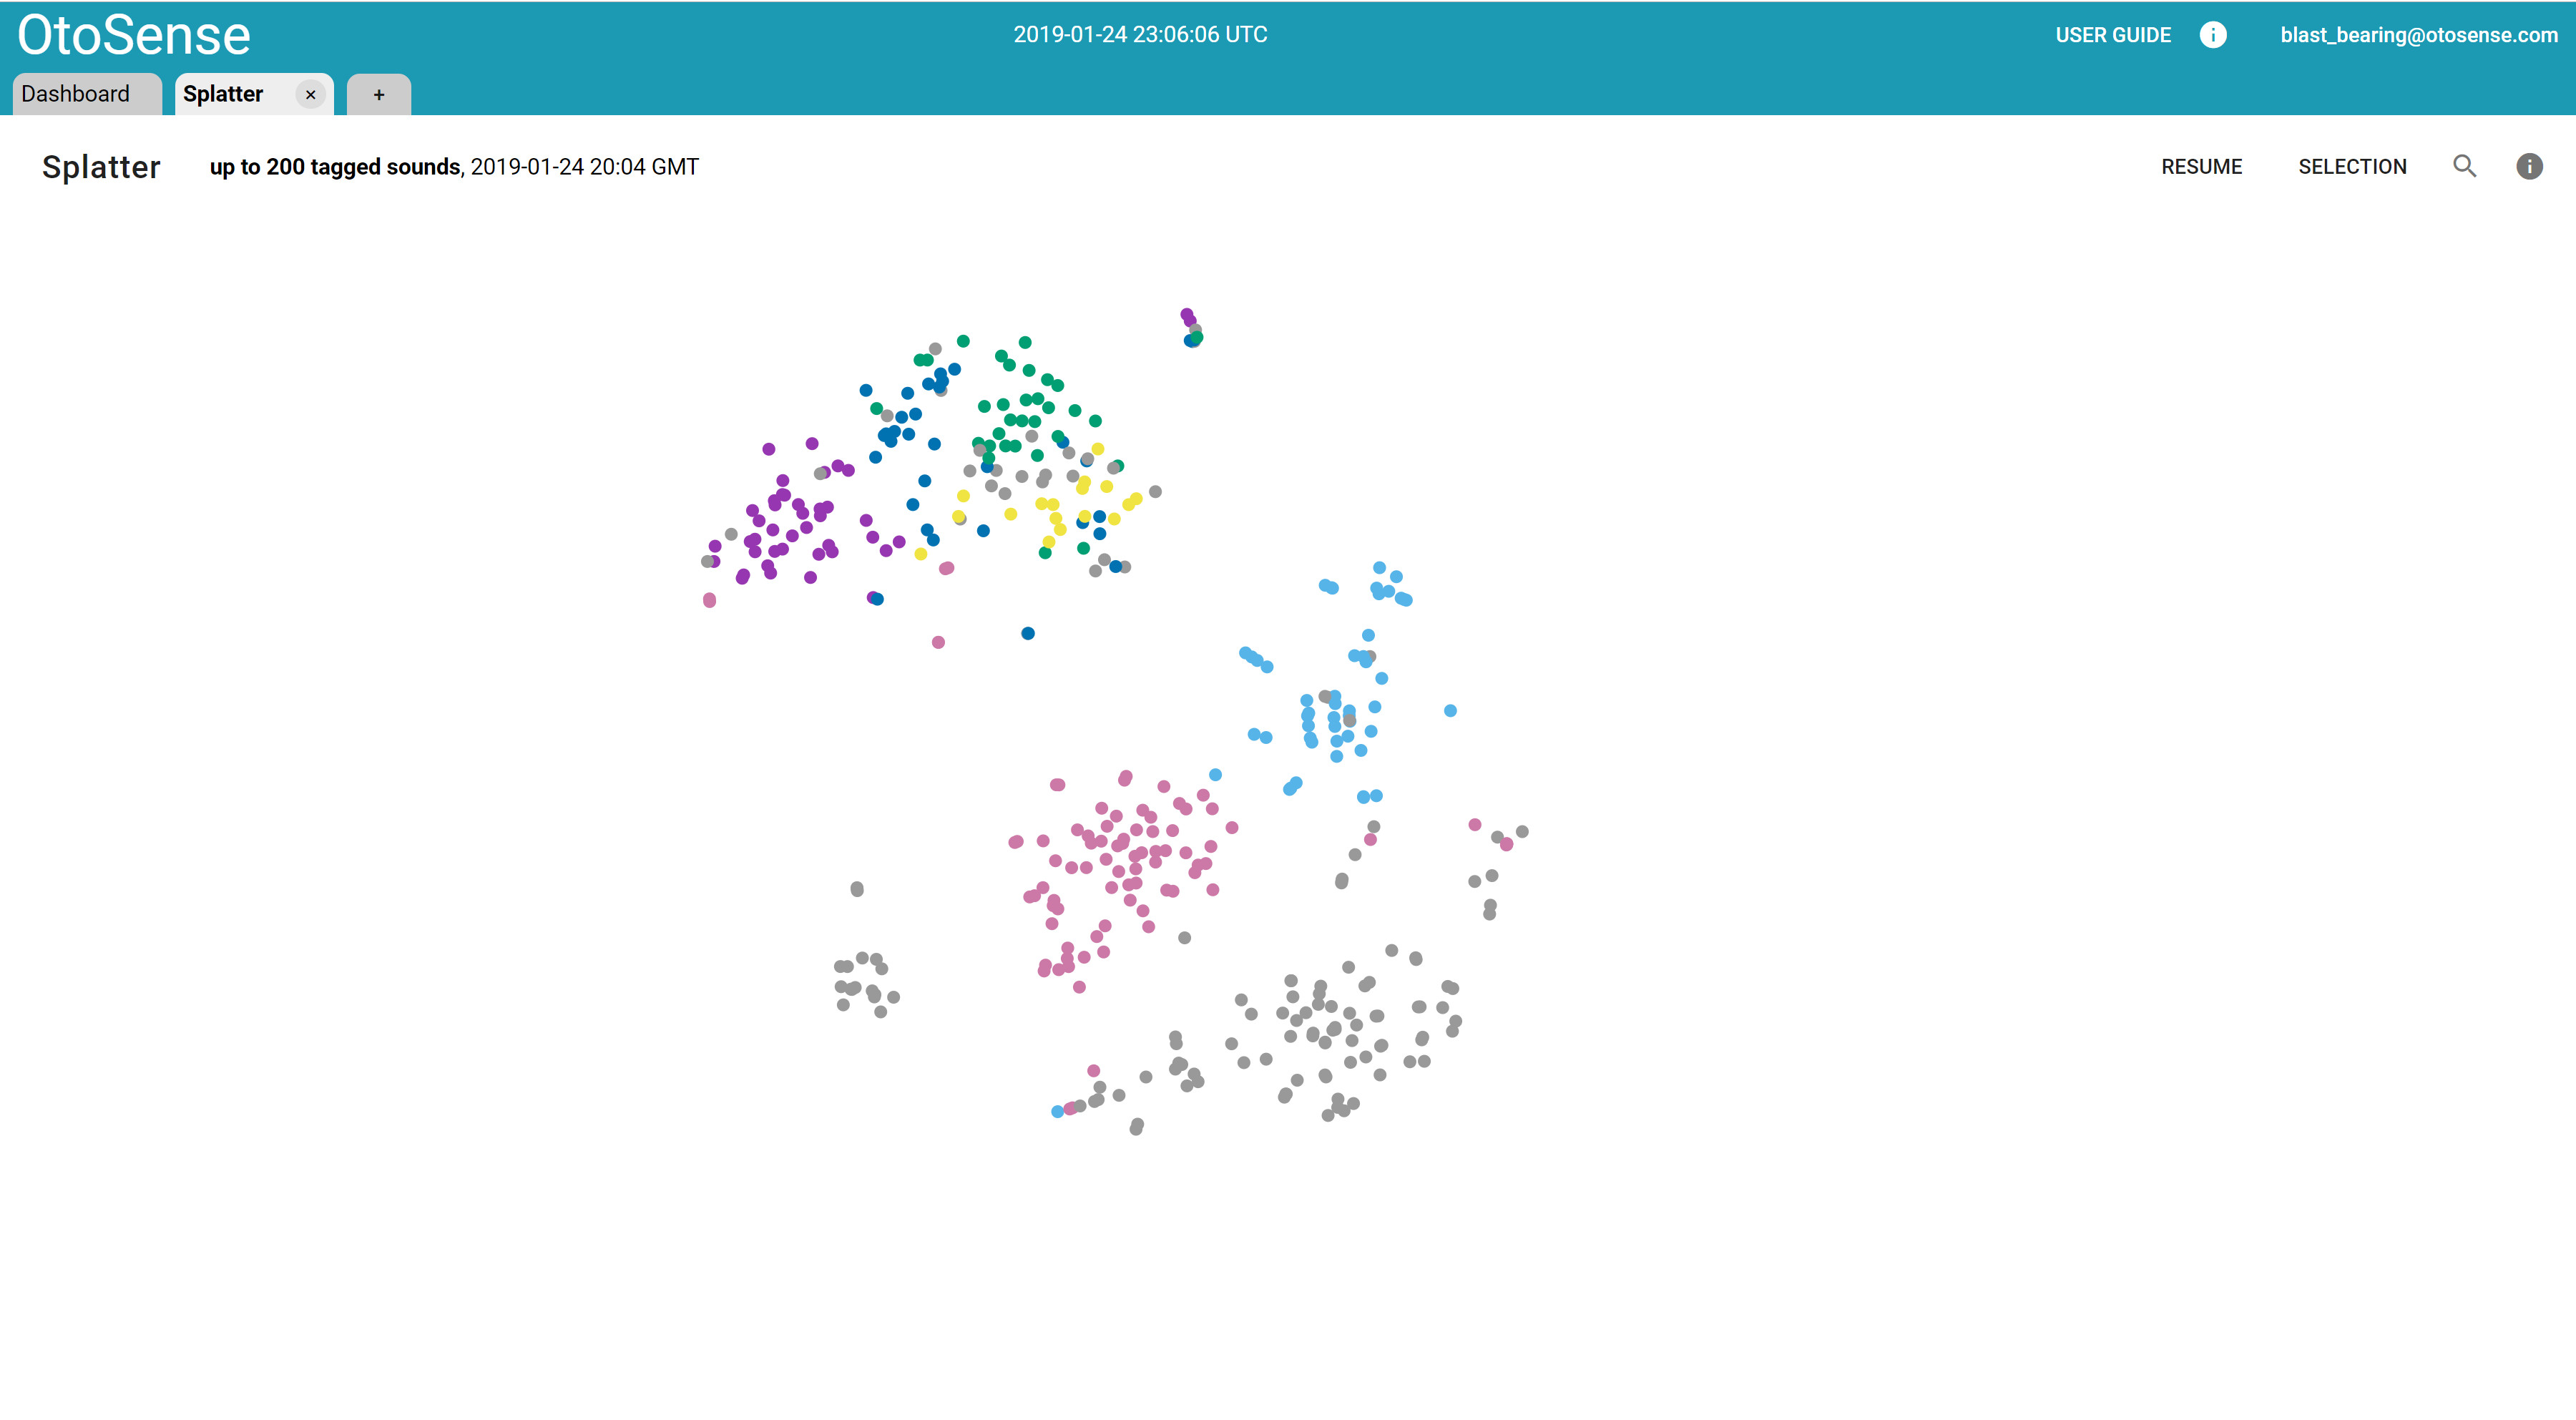
The OtoSense Sound Platter (also known as splatter) allows for the exploration and tagging of sounds with a complete overview of the data set. Splatter makes a selection of the most interesting and representative sounds in a complete data set and displays them as a 2D similarity map that mixes labeled and unlabeled sounds.
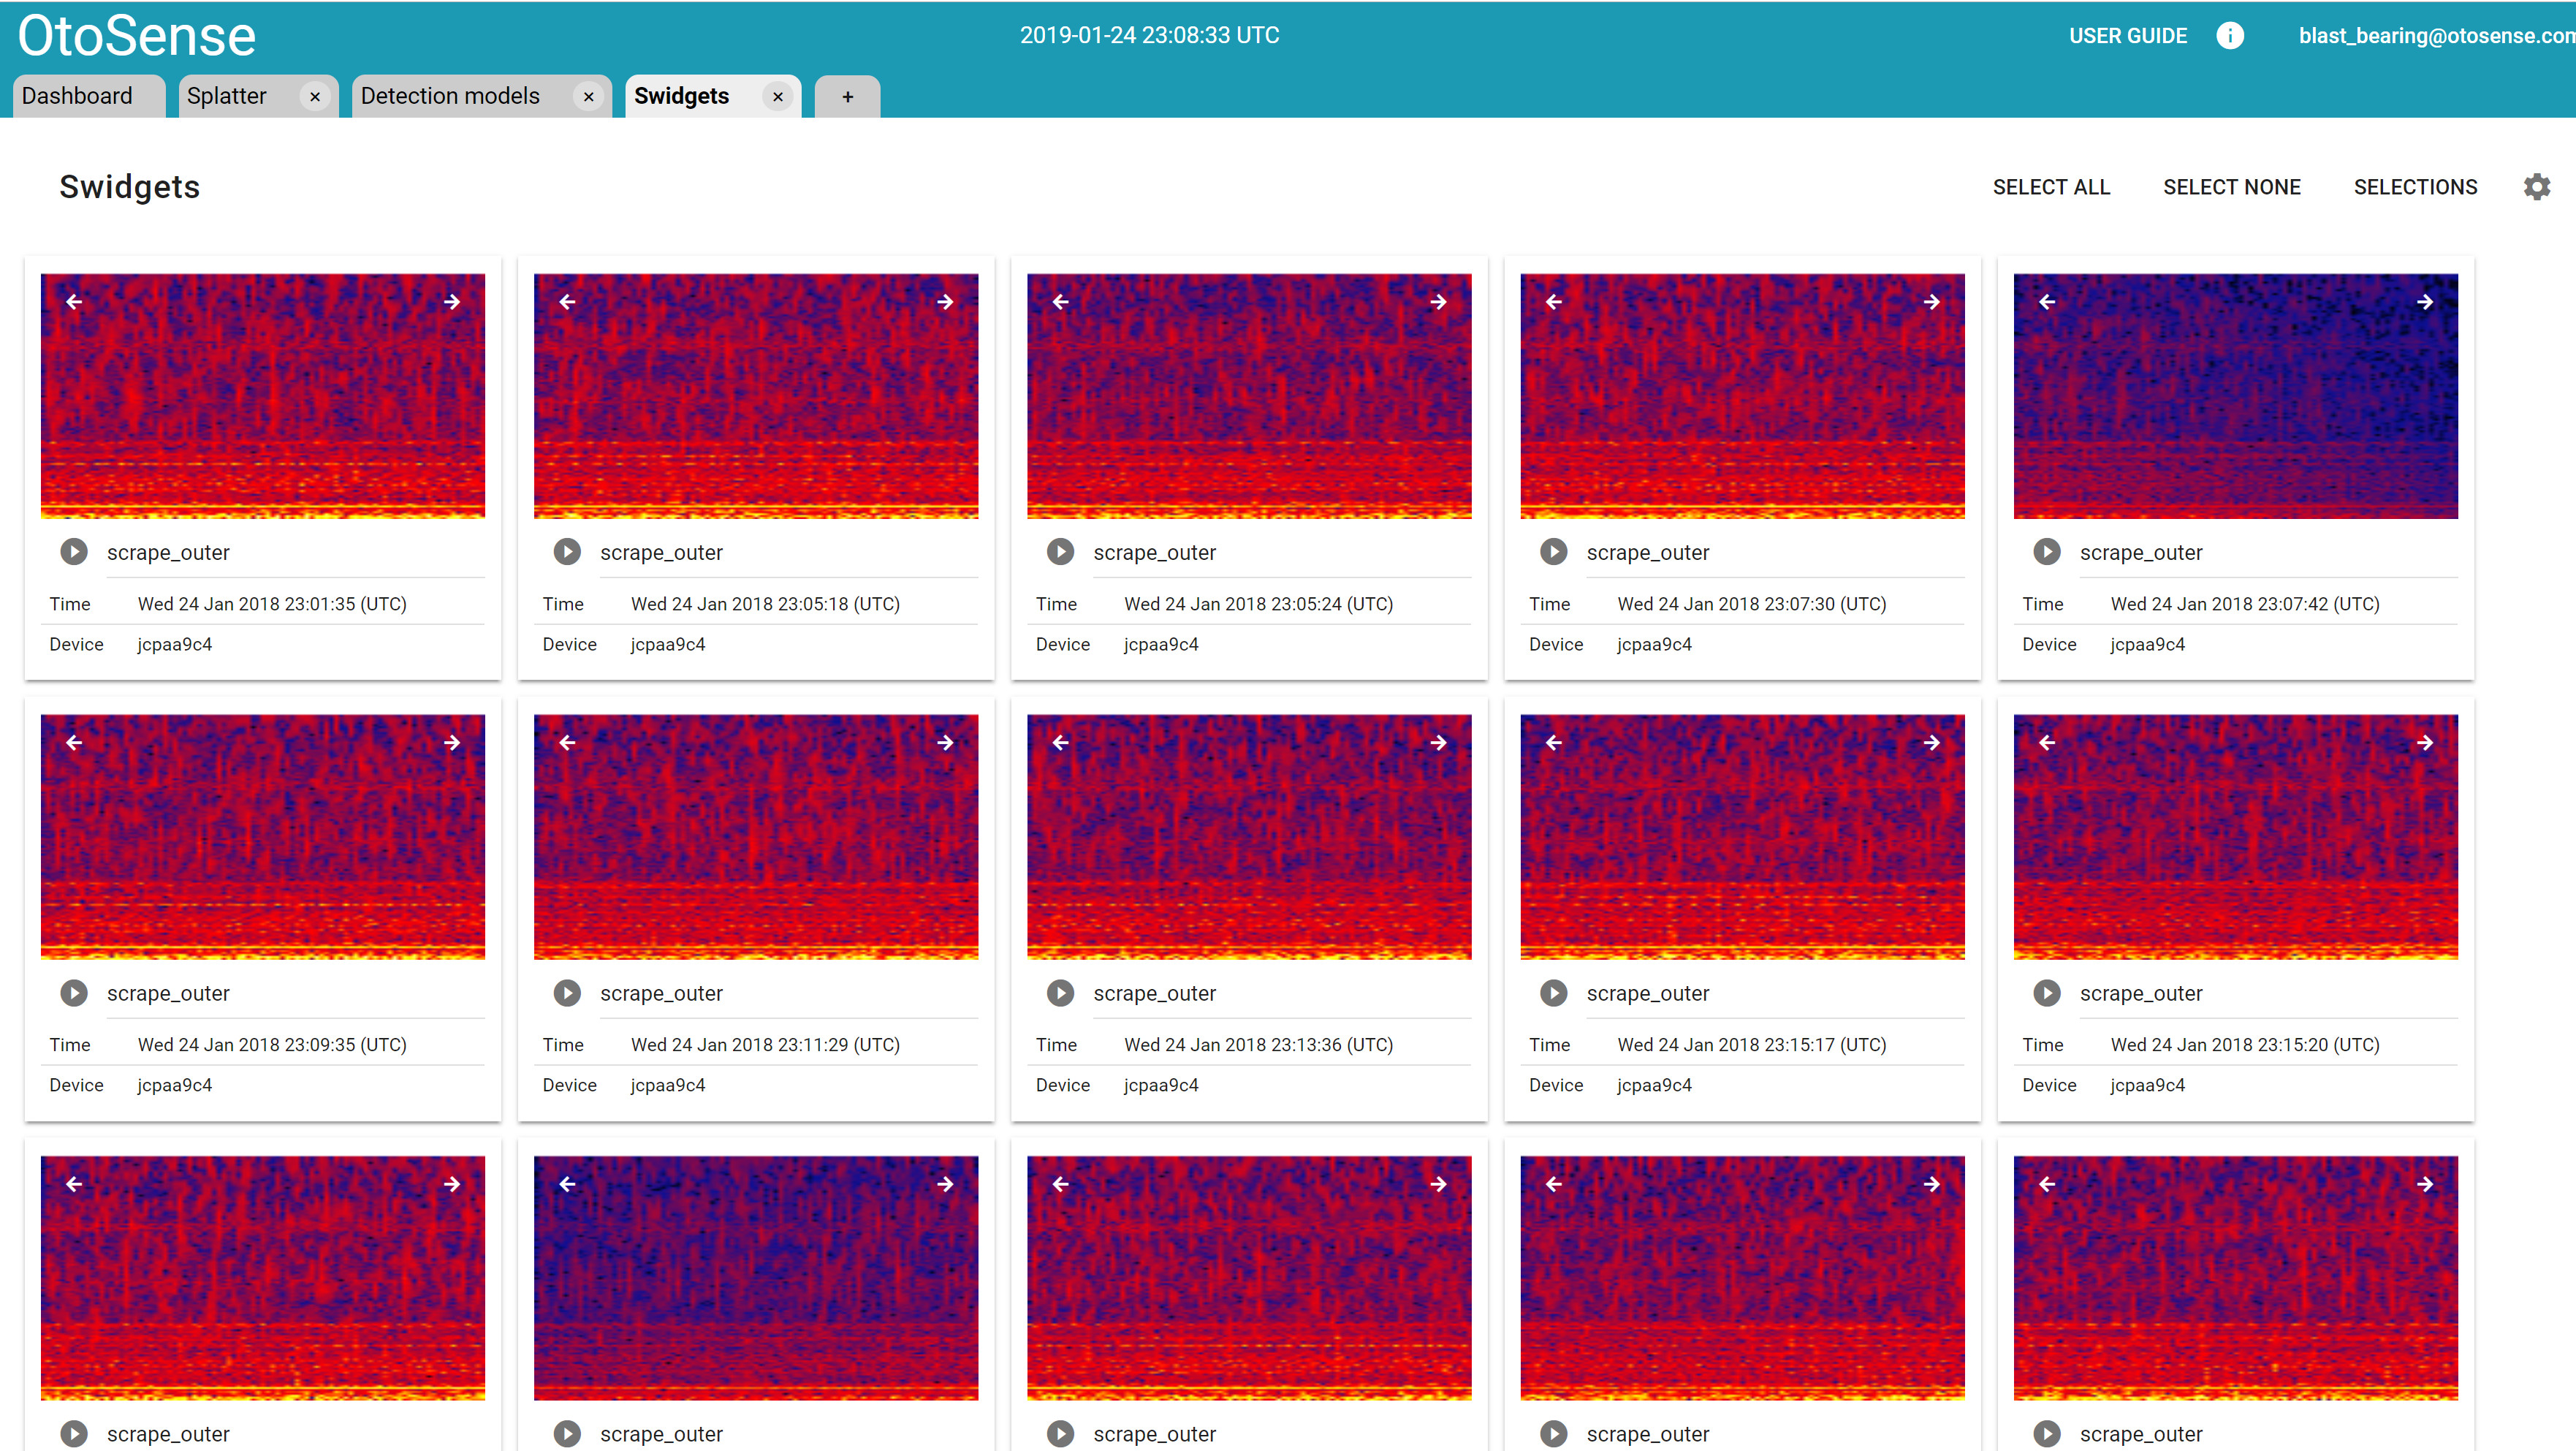
Any sound or vibration can be visualized, along with its context, in many different ways – for example, using Sound Widgets (also known as Swidgets).
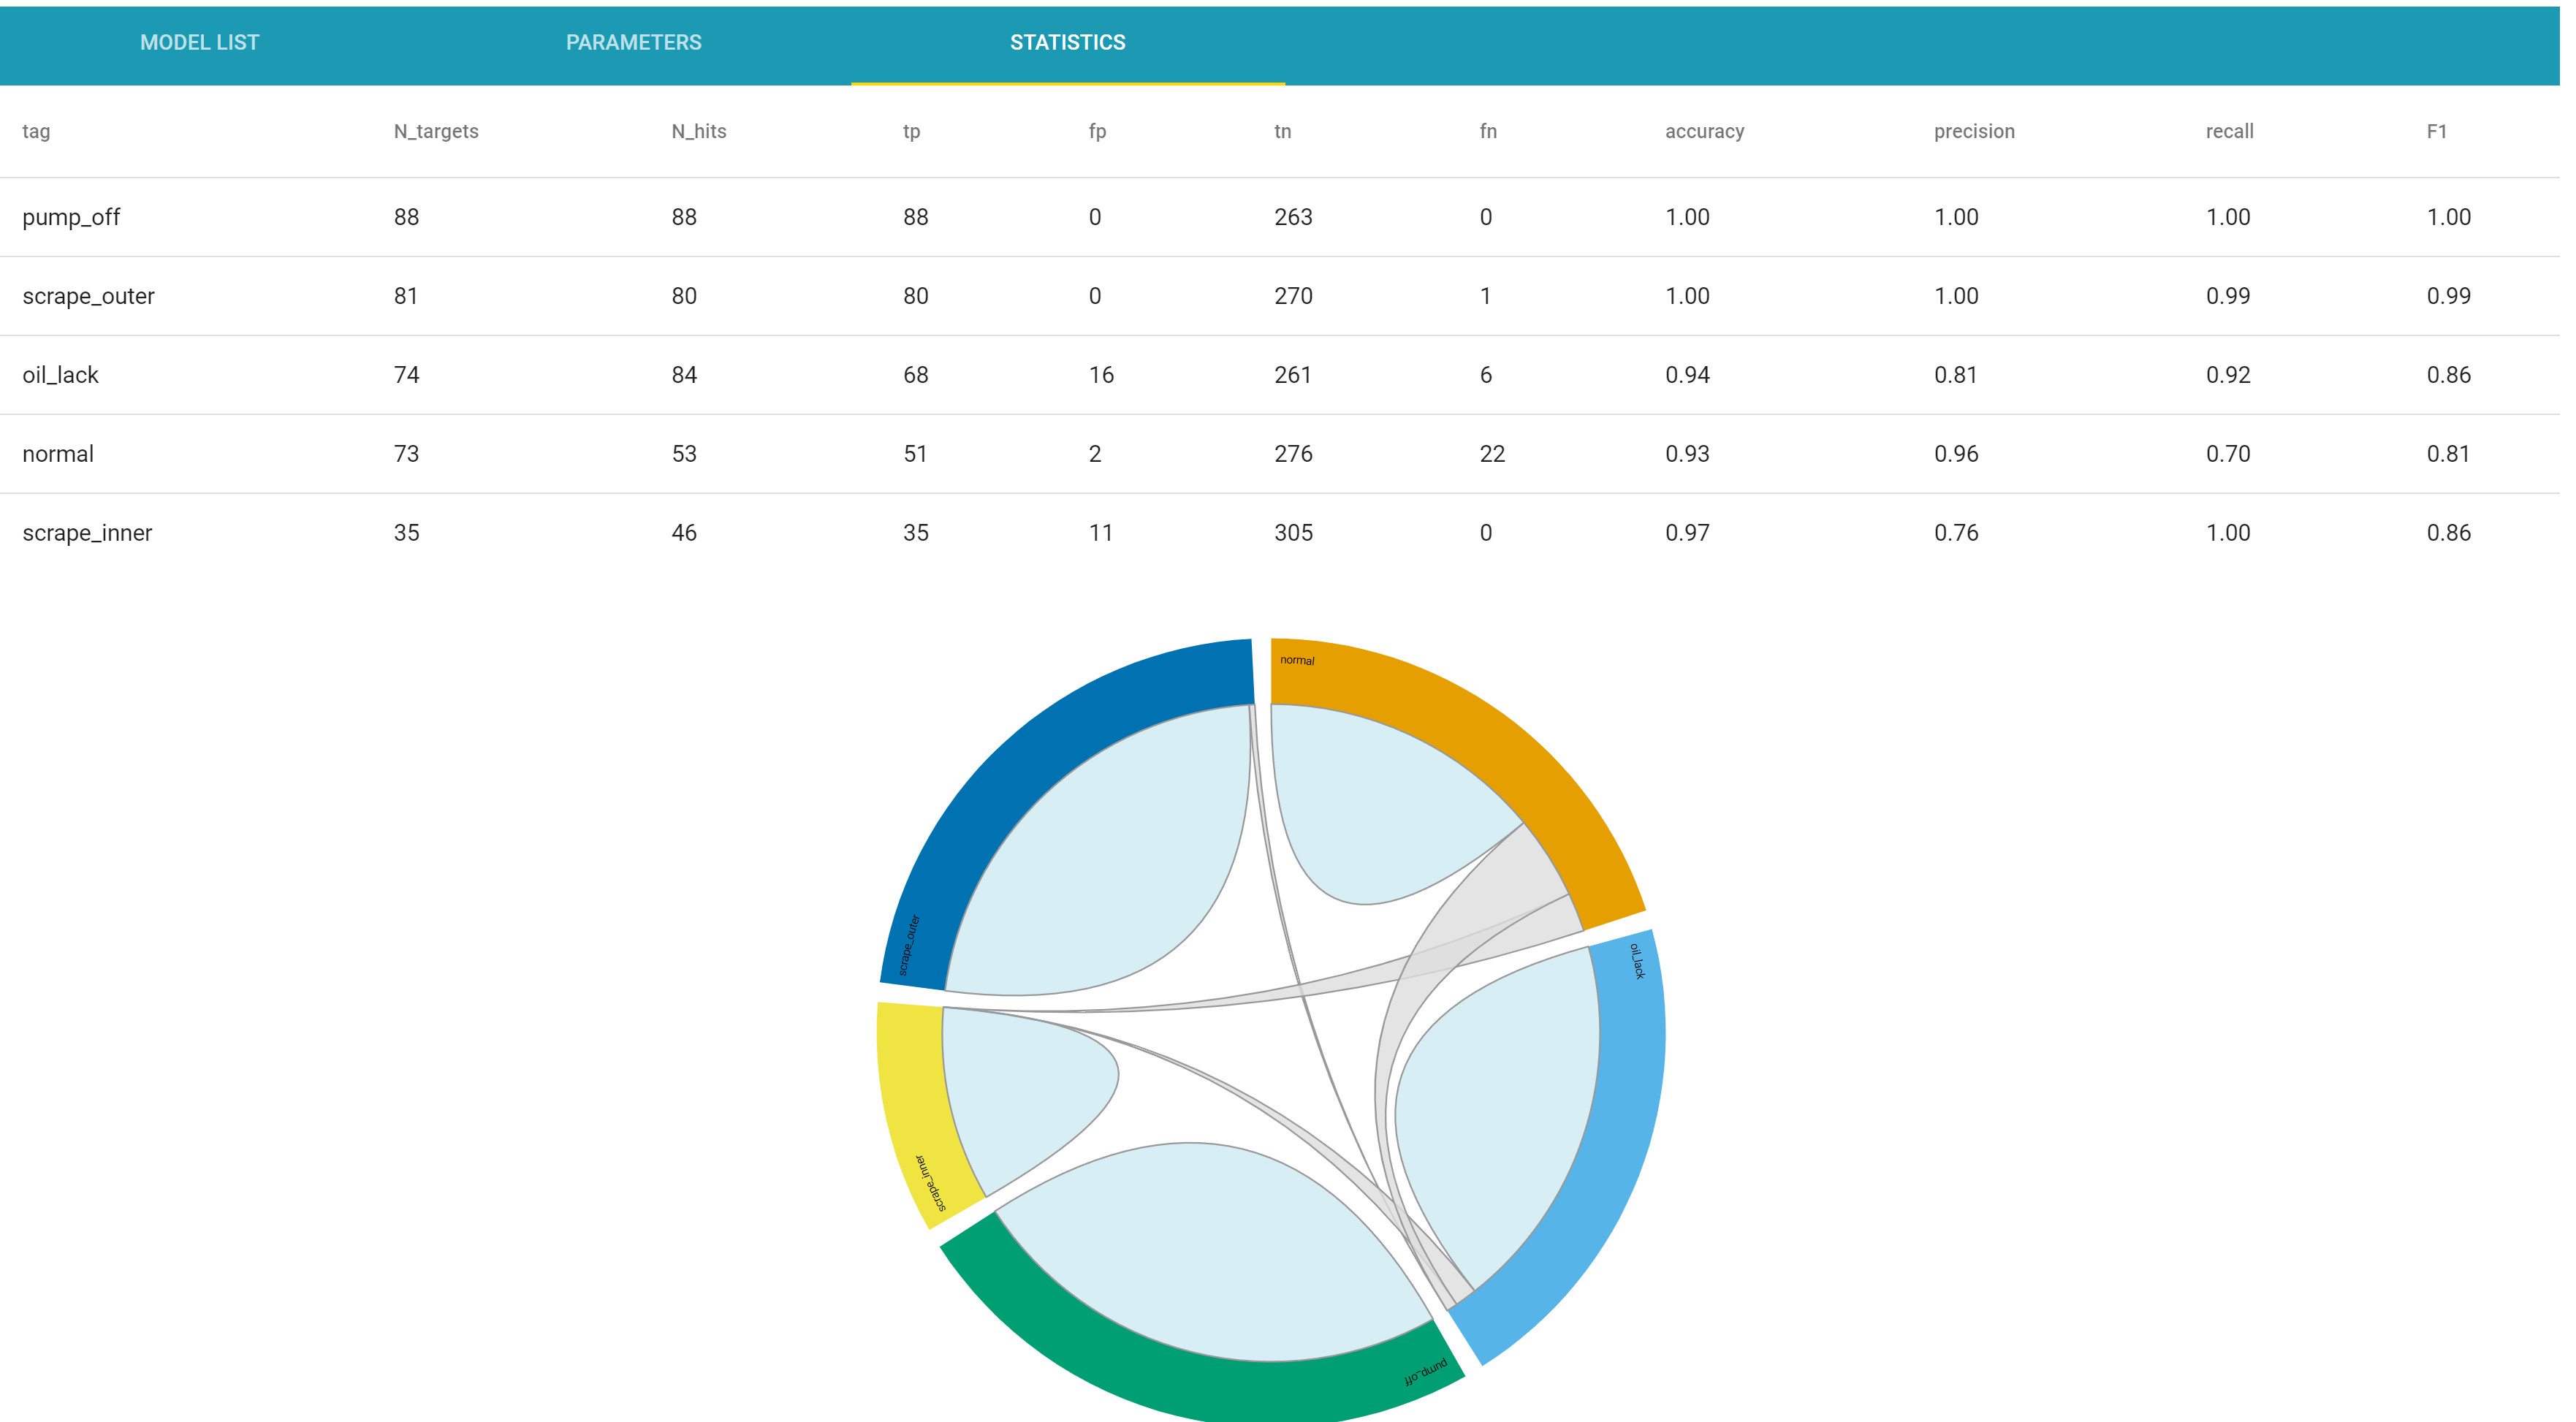
At any moment, an outlier model or an event recognition model can be created. Event recognition models are presented as a round confusion matrix that allows OtoSense users to explore confusion events.
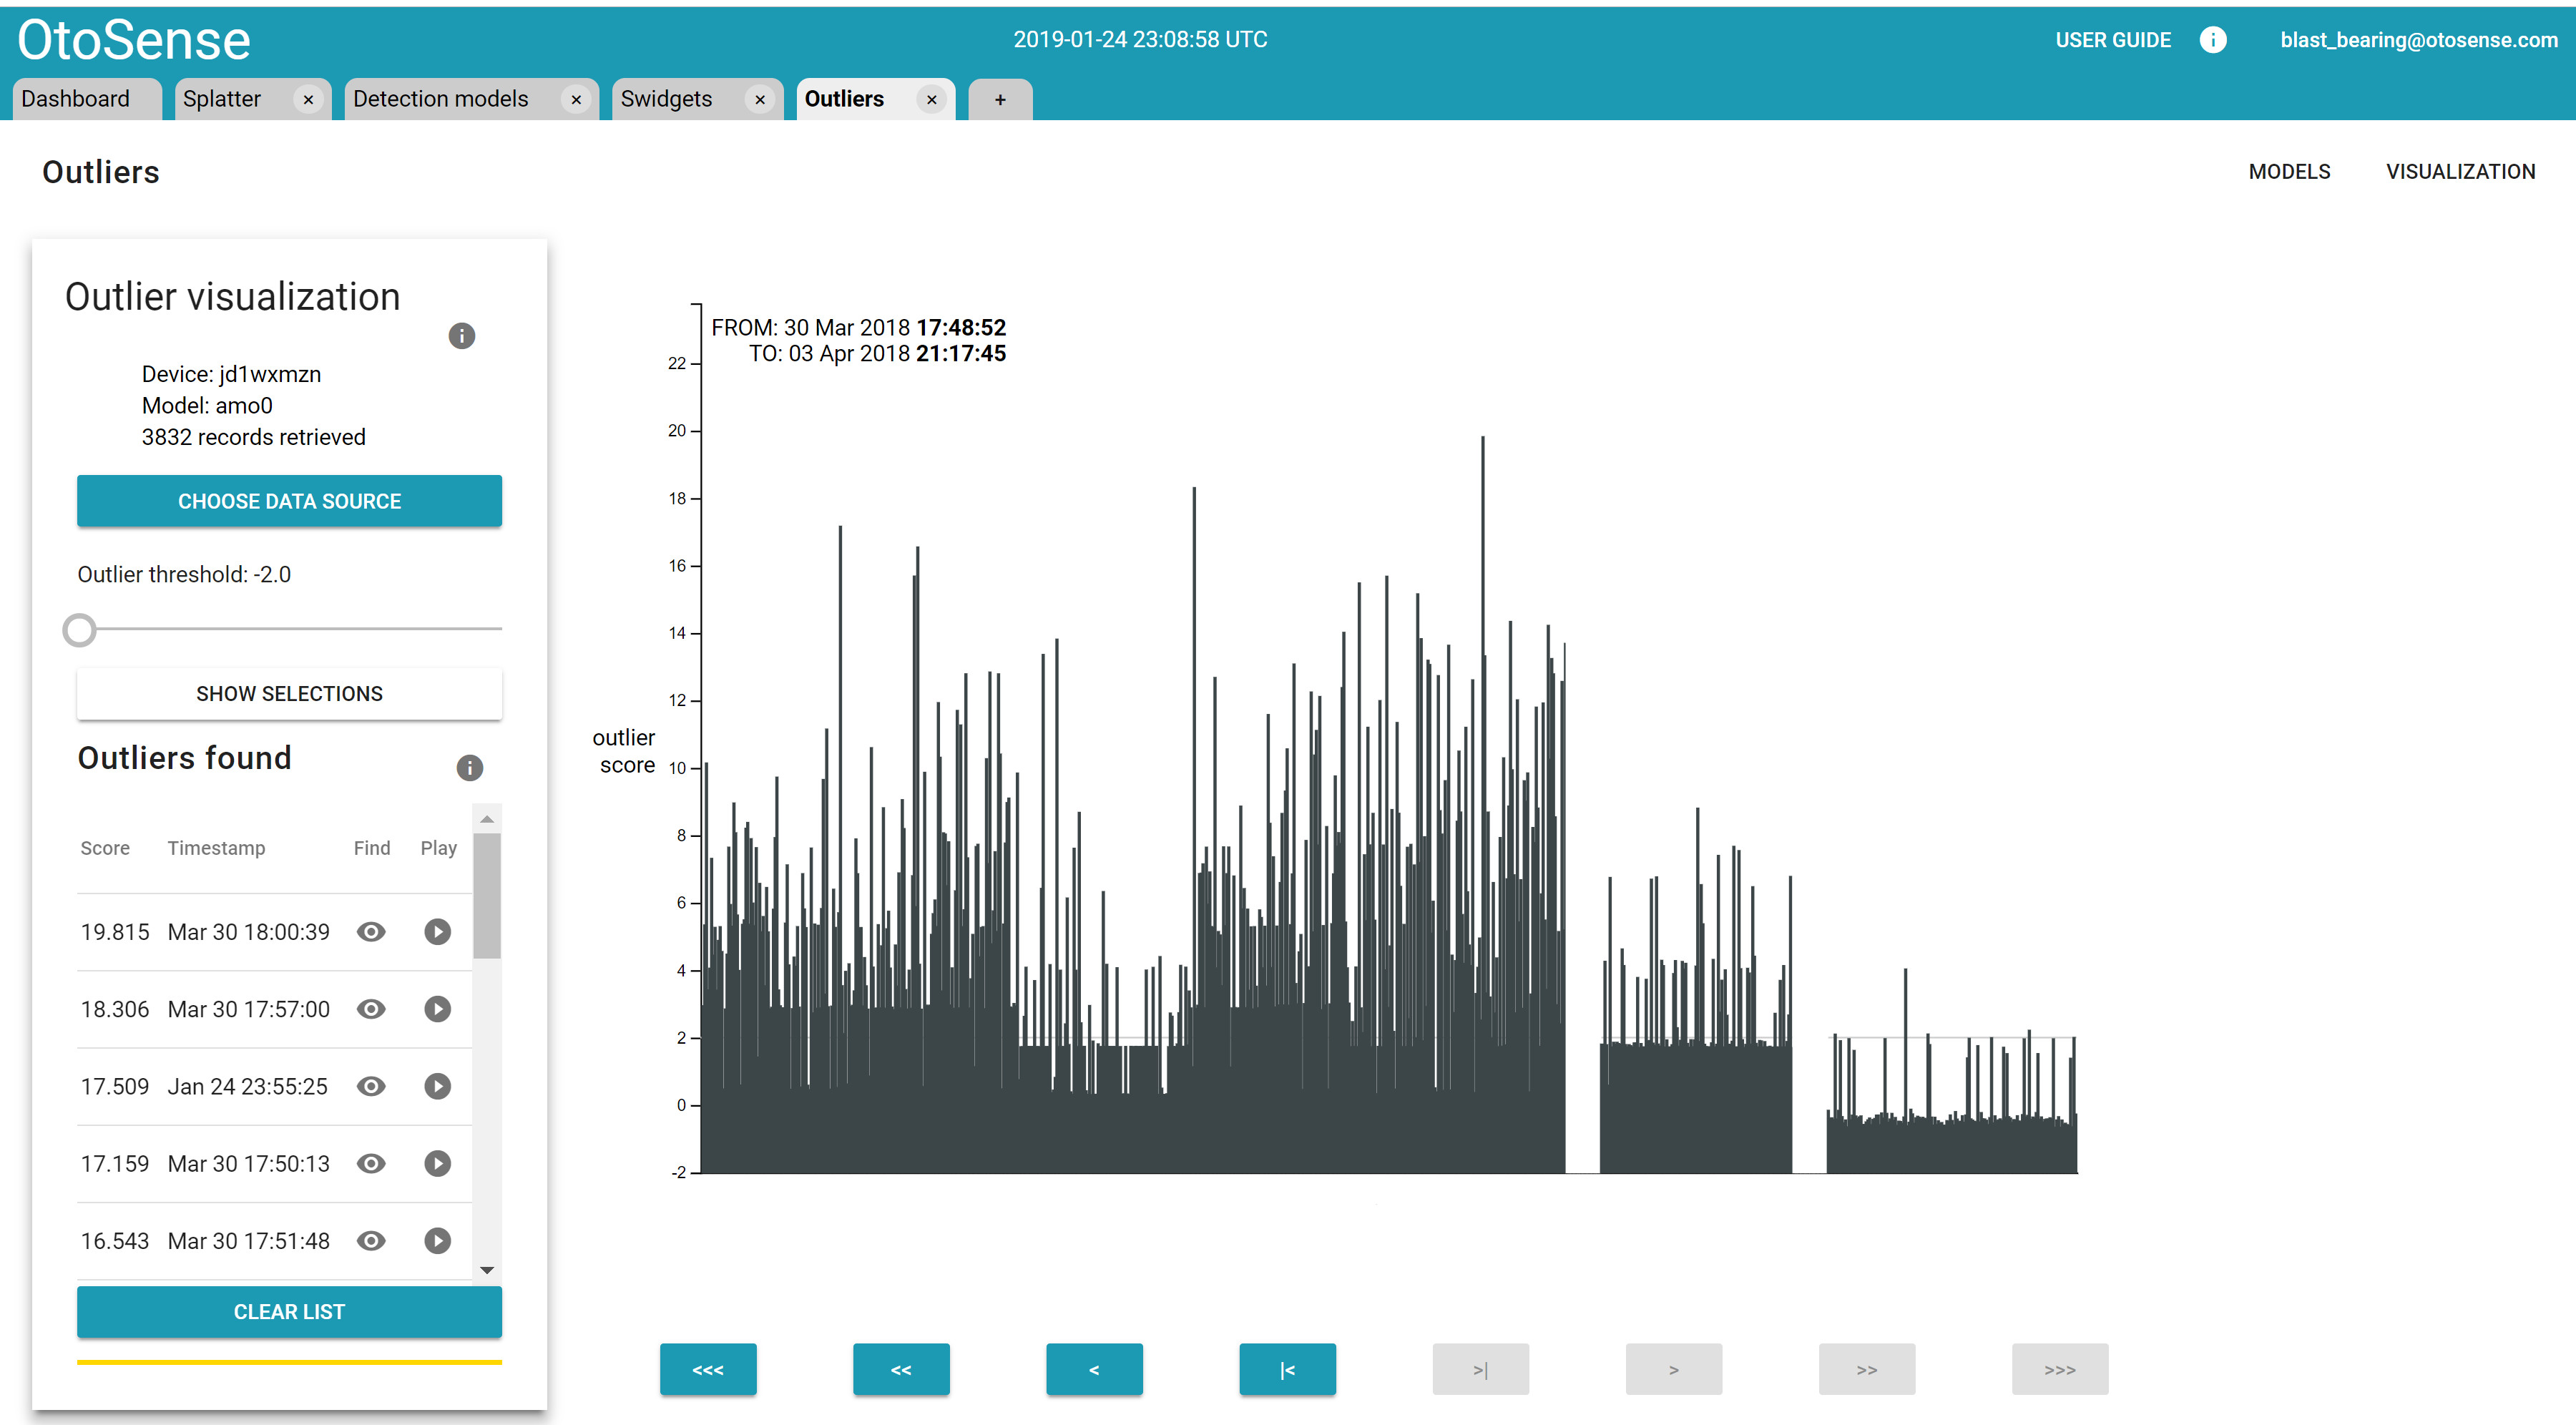
Outliers can be explored and labelled through an interface that shows all the unusual and extreme sounds over time.
The Continuous Learning Process, from Anomaly Detection to Increasingly Complex Diagnostics
OtoSense has been designed to learn from multiple experts and allow for more and more complex diagnostics over time. The usual process is a recurring loop between OtoSense and experts:
- An outlier model and an event recognition model are running at the edge. These create outputs for the probability of potential events happening, along with their outlier scores.
- An unusual sound or vibration above the defined threshold triggers an outlier notification. Technicians and engineers using OtoSense can then check on the sound and its context.
- These experts then label this unusual event.
- A new recognition model and outlier model that includes this new information is computed and pushed to edge devices.
Conclusion
The objective of the Analog Devices' OtoSense technology is to make sound and vibration expertise available continuously. This technology’s use for machine health monitoring in aerospace, automotive, and industrial monitoring applications has shown performance in situations that once required human expertise and in situations involving embedded applications, especially on complex machines.
References
Christian, Sebastien. “How Words Create Worlds.” TEDxCambridge, 2014.