Using software to find hardware bugs
October 17, 2017

There is one basic law of CPU design, and it applies to everything from microprocessors to microcontrollers to system-on-chips: software always uncovers hardware bugs.
There is one basic law of CPU design, and it applies to everything from microprocessors to microcontrollers to system-on-chips (SoCs): software always uncovers hardware bugs. Hopefully, you’ve been able to uncover those bugs before you get to manufacturing. Otherwise, you could be facing quite an expense.
If you’re in the latter situation, what happens next depends on both the severity of the problem and the ability “code around” the bug. Be careful with this solution however, because it requires any subsequent processor version to replicate that bug for backwards compatibility.
A more likely scenario is that you have to drop the feature in which the bug is causing an issue. Worst case is having to do a re-spin of the masks. That’ll hurt you in both time and cost.
The best scenario is to catch those bugs before you commit to silicon. That could mean verifying software and hardware at the same time, a tricky but far from impossible task.
Finding hardware bugs: Know what you’re getting into
It’s important to have a good handle on the tools you’ll be using. First, simulating software can be excruciatingly slow, like measured in years. For anything more than trivial code, look for another option.
Emulation, on the other hand, could make the difference here. You can instantiate the hardware on the emulator and then have it run actual code in a reasonable timeframe—not real system speed, but fast enough to make emulation a workable solution.
Note that many engineers are reluctant to use emulation because, in the past, the only access to the internal processor state was through JTAG. Emulators run at clock speeds of just a few MHz; JTAG on an emulator runs at a fraction of that. In other words, they’re slow. For example, if you want to single-step an instruction, that means transferring about 4 Mbits through JTAG. At 1 MHz on an emulator, that would take four seconds of very expensive live emulator time.
Bear in mind that during those four seconds, the processor state stays fixed, but the outside world carries on. If you're just debugging processor code, this may not be an issue. But if you're trying to debug an interaction with non-processor hardware, you could have a problem on your hands because everything external to the processor will have changed state by the time you complete that single step.
Times have changed for emulation
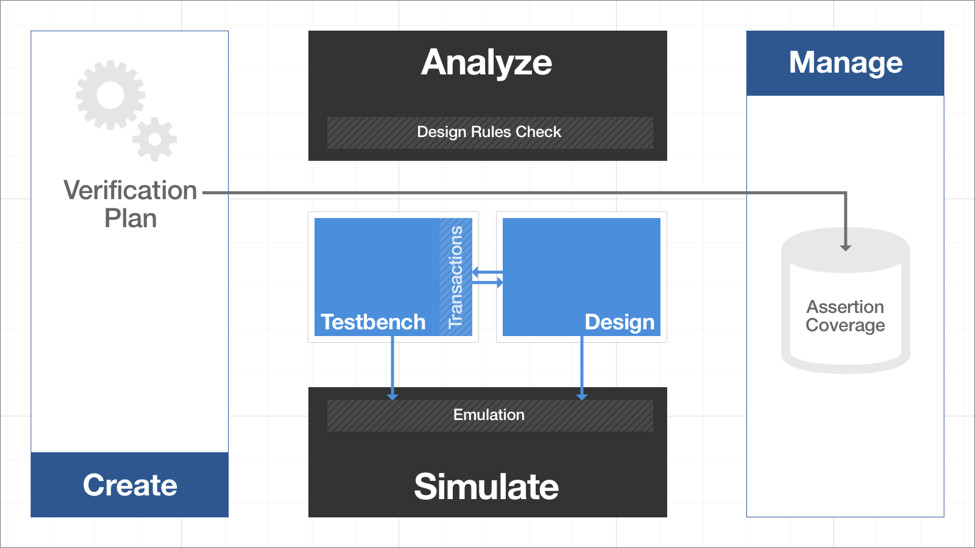
The good news is that yesterday’s emulator does not resemble what’s currently attainable. For example, Mentor has a way to capture the processor state that doesn’t rely on JTAG; hence, it can occur quickly, in the 40- to 50-MHz range. And the data is fed to the CoModel host, where the state history can be stored and recreated, cycle by cycle.
Now you can replay any offending software against that stored trace so you can see where things go wrong. You can single-step; probe registers and memory; and/or watch the buses, all without intrusion—your debug efforts won’t change the system state. In addition, this can be done offline, without a live emulator, making it more cost-effective.
The historical concerns about software debugging no longer apply. You can exercise your computing platform thoroughly before tape-out, and software developers can begin software development long before silicon availability and even before FPGA prototypes are available, using debugging tools that are designed to be familiar to software engineers.