
RTOS debugging, part 1: Dealing with timing issues
August 29, 2017
There are several reasons that debugging an RTOS system is different from debugging a single-threaded ?superloop? system where you wrote all code yourself, but these are the top two.
There is, no doubt, a learning curve when you begin using a real-time operating system (RTOS) in your development. You will work at a higher abstraction level, using more or less parallel tasks rather than just subroutines, and you will need to consider how your tasks shall share data and the processor time with each other. You need to assign runtime priorities to these tasks and it is not immediately obvious what the best solution is. Last, but not least, you need to learn how to use the RTOS itself, like configuration and the API functions for controlling tasks and communicating between them.
Once you’ve mastered all that and you are writing your code, it’s time for the next learning curve – you now have to learn how to debug your code, too.
There are several reasons that debugging an RTOS system (typically using preemptive multitasking) is different from debugging a single-threaded “superloop” system where you wrote all code yourself, but I would say the two top reasons are
- With multiple tasks interacting and competing for shared resources, the software behavior can be affected by software timing and RTOS scheduling behavior, not visible in the source code.
- You are no longer in direct control of the program flow – task switches may strike anywhere, at any time.
There is really no way around these issues. You will have to deal with them, since you have to trust the operating system to schedule your tasks and manage timers. Some task switches may be predictable and hence known, but generally you have no idea where in the program flow they will happen. And as the number of tasks/threads you have in your system grow, so do the number of combinations – there can be an enormous number of possible execution scenarios, with different timing and execution order, and most of them will work just fine. But then there is that “nightmare bug” that one of your customers have reported, the one that only appears when conditions are just right, that you cannot reproduce.
The sidebar below lists some typical symptoms that you may see if you have RTOS-related timing bugs. Note that many of these issues often have a degree of randomness; the problem appears sometimes but not always.
Bugs that depend on timing can be really hard to reproduce or find, especially since most debug tools provide little support for multi-tasking issues. It seems to me that most tools still are focused on static halted systems, rather than the dynamic software behavior. In contrast, many systems have real-time requirements and can’t be halted for debugging.
Some typical symptoms of RTOS-related timing bugs
- Tasks works fine in isolation but not as a full system
- Slow performance
- System locks up, or sometimes stops responding
- System appears brittle – minor changes results in weird errors
- Random variations in output timing
- Sometimes corrupted data, or wrong output
- Random crashes/hard-faults
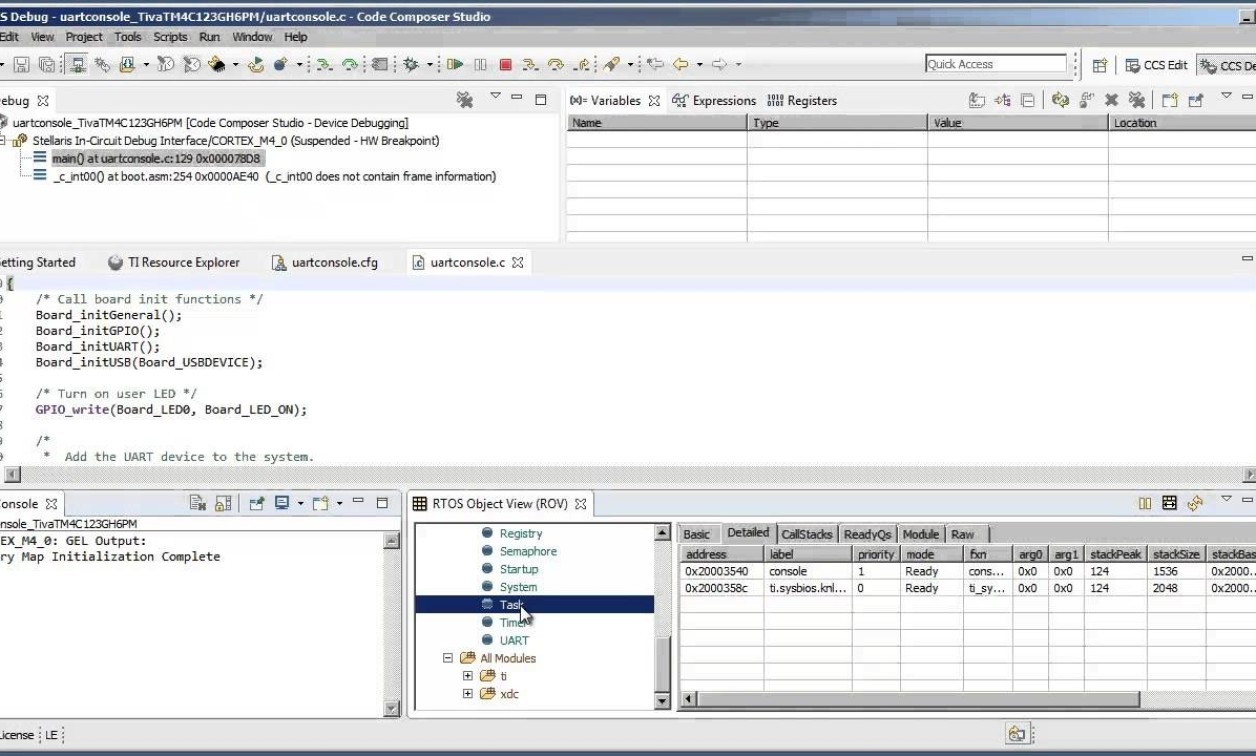
Beyond looking for symptoms, you should of course use any tools you have, and the instrumentation they offer, to inspect your RTOS and application for bugs and misbehavior. For instance, your IDE can probably support easy inspection of RTOS objects during your debugging (sometimes via plugins) and may even analyze the stack usage of your tasks. And the RTOS may allow you to measure CPU usage at a high level, allowing you to find out how much CPU time each task requires on average. Some debuggers can present variables in real time as the system executes (“live watch”), although this may not be suitable for rapidly changing variables.
If you want to see a reliable timeline of what’s really happening inside your application and the RTOS, you need RTOS-aware tracing that records things as they happen and a tool that can help you make sense of the trace information.


