Energy consumption in modern microcontroller systems, part 2: ULPBench-core profile, EEMBC documents, and MCU datasheets
October 26, 2017

Data sheets and descriptions like app notes are sources to understand company data about energy demand of their products. Can engineers make proper decisions based upon the available data?
Energy consumption comparison of MCU/SoC systems – is one benchmark enough or do we need a parametric benchmark?
An important factor in the selection, the market positioning and success is the energy consumption of an entire system of a product. The traditional approach to express efficiency in microampere (uA) or microwatt per megahertz (uW/MHz) isn’t sufficient enough anymore. Energy storage systems store neither uA nor uW but Joule, simply means energy. The comparison of MCU/SoC devices with sufficient energy usage becomes the prime focus of users.
There are many publications about this topic in the industry. Is one benchmark enough to select a microcontroller, a MCU family or an entire MCU manufacturer? Are publicly available technical documents enough? How easy is it to choose the right vendor for your application?
Part 1: A BENCHMARK FOR ULTRA-LOW-POWER: ULPBENCH™-CORE PROFILE
Part 2: ULPBENCH-CORE PROFILE, EEMBC DOCUMENTS AND MCU DATASHEETS
Part 3: THE IMPACT OF OPERATING TEMPERATURE ON ENERGY CONSUMPTION
Part 4: MCU DATASHEETS, OPERATION MODES, CONTROLLBITS AND - REGISTER, CURRENT AND MODETRANSFERPARAMETER
The energy demand is an important factor in the selection, the positioning, and the market success of an electronic system.
The traditional approach to express efficiency only in microampere (uA) or microwatt (uW) per megahertz (uW/MHz) isn’t enough anymore. Energy storage systems neither keep uA nor uW – they store Joule.
Part 1 looked at the only available benchmark for low-power microcontrollers and investigated two parameters: supply voltage and agreed temperature. In part 2, we look at data and documents based on the EEMBC organization's public benchmark data.
Relative to those benchmark data, data sheets and descriptions like app notes are sources to understand company data about energy demand of their products. Can the majority of engineers make proper decisions based upon the available documents without extensive research?
Question 1: How do you assess the benchmark data? How are they relative to data in data sheets?
From the EEMBC benchmark results (BV instead of EEMark-CP) we calculate the operating current and sleep current as examples for a couple of devices. Together with the run time of the EEMBC-Software and the data sheet parameter we can determine deviations between calculated (typical parameter) and measured results. In order to verify if an assessment is possible we take public data.
The calculations
The benchmark consortium has defined following formula:
BV = 1000 / E
E is the average of 10 ULPBench cycles and therefore the energy demand per second. E is expressed in uJ/s.
BV is the meaning of EEMark-CP.
From those benchmark data, we calculate the average energy demand with this formula:
E = 1000 / BV
E is uJ/s, or the energy which is used in a second.
The average current consumption can be calculated using this formula:
I(avg)= E / V
V is the supply voltage – in practical measurements, the real measured voltage can be taken.
From the data sheet, we take the typical current consumption in sleep mode phase. The calculated average current in run mode (I(RUN_avg)) is then calculated from the benchmark data (BV) and I(standby).
From the data sheet and the suggested operating frequency we calculate the supplier’s current consumption I(RUN) in run mode. I(RUN) is the value based on data sheet information while I(RUN_avg) is a calculated value.
The published data on the EEMBC web page not always show the operation mode time. Thus, distinguishing energy for operation- and RTC mode is going to be difficult. Together with time for the operation mode (t(RUN_cR/D) or t(RUN_D)) the energy consumption can be compared between the measured data E_BV_cR and the datasheet parameter E_D.
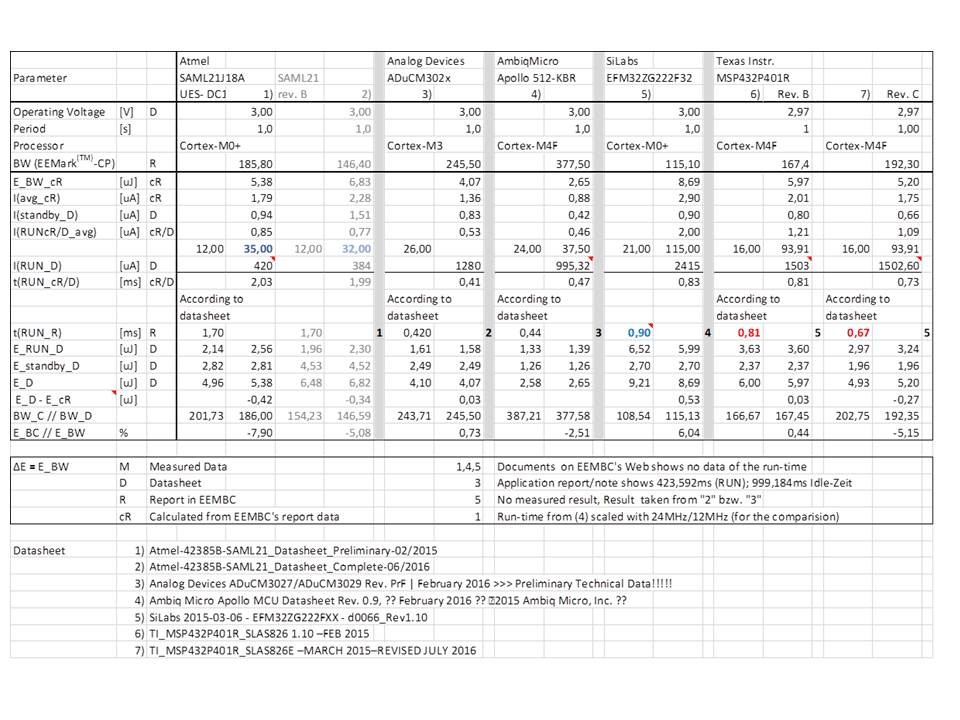
[Figure 6a/b | Sources are EEMBC-Benchmark values and –data, datasheets and reports of the suppliers. We list five devices as examples. There is a need for clarification between EEMBC documents and datasheet values.]
The consumed energy listed on the ULPBench-CP-page show deviations versus the results based on data sheet parameter. The deviations cannot be determined based upon pure data sheet parameter and ULP-Bench parameter. Such deviations may come from typical data variations or switching losses and are nowhere mentioned in the data sheet. In some applications those deviations between measurements and data sheets play a minor role. In modern sensor applications, e.g. with accelerometers and analog/digital conversion of measured data, a sampling rate of a few Hz to KHz is necessary. Then, switching losses can cause significant energy consumption. The conversion of real environment data to digital domains represents a much bigger challenge. Further activity in this area is needed since the current benchmark only represents limited value for the user. In IoT sensing, data conversion and transmission have to be considered, too.
Question 2: Can descriptions and data sheet parameters help assess worst-case energy consumption?
In figure 6, energy consumptions are listed for operation- and sleep-mode. The ratio goes from 3:4 all the way to 2:1. Using data sheets, you realize that most of the parameters that are necessary to estimate an application life span for a battery operated system are missing. The data sheet ADuCM3027 REV. PrF (shown on ULP-Score @ EEMBC) from February 2016 gives typical data at 3 V and 25°C, but no maximum data. In data sheet Rev. PrG, parameter run mode data can be found, but no information about low power currents. The data sheet from Ambiq Micro Inc. ("Apollo MCU Data sheet Rev. 0.9" from February 2016) contains only typical current consumption data in uA/MHz with an internal RC oscillator (HFRC) at 24 MHz. Due to missing parameters (typ, max, max over temp) in the latest data sheet, it becomes impossible to determine if a device will last a predetermined live time with a given energy source above room temperature.
Question 3: How do you understand the current data in RUN mode?
The current in RUN mode is mostly described in uA/MHz. Most low power MCU/SoCs operate below their performance possibilities of the semiconductor process. We can assume a linear current consumption increase in terms of uA/MHz. Based upon this fact, there is going to be an interesting picture in the published data.
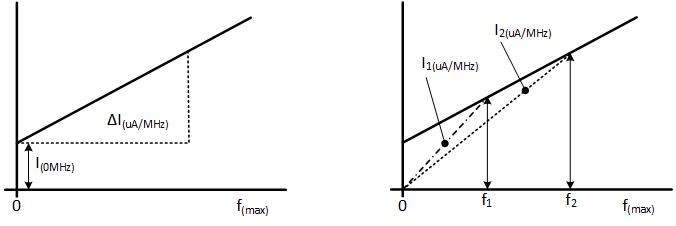
[Figure 7a/b | Current consumption over operating frequency]
There are different data about current consumption both in LDO/linear regulation mode as well as in DC/DC mode. Some data sheets point out the current consumption at a particular frequency, others show current per MHz. The current consumption cannot be precisely determined. Some data are given as max data. Product life span or operating safety (energy harvesting) cannot be calculated based on those data.
The Apollo Datasheet Rev. 0.9 (Ambiq Micro Inc.) only shows parameter for one frequency – at 3.3V/1.8V and HFRC (high frequency RC) of 24MHz. There are frequency dividers available but the processor core seems to only work at 24MHz; a non-calibrated value of typ. +/- 2%. It can be calibrated using the 32.768 KHz crystal (XT-oscillator). Also, there is no option for a different crystal; this isn’t intended in the clock generator.
You find another example in the SiLabs application note AN0027.

[Figure 8 | The datasheet shows different rising slopes (mA/MHz) with an existing base current. The published graph confirms this. Source: Silicon Laboratories, AN0027 Rev. 1.03.]
Based on this graph (not pre-scaled from 28 MHz), we can assume a static base current of about 55uA and a dynamic part of roughly 156 uA/MHz need to be considered for a pre-determined frequency. A much higher base current is consumed when the application is run in a “pre-scaled” situation. You can expect worse benchmark data in “pre-scaled” mode or to express it differently, the device needs more energy for the same program or runs shorter with a given limited energy source.
The data sheet itself doesn’t say anything about base current. For the base current, you find in the app note: static power, core domain: 34 uA@25°C, 3 V. In the data sheet, you find for static base current: 155 uA/MHz (@ EM0, 14 MHz, HFRCO, 3.0 V). At 1.2 MHz (@ EM0, 1.2 MHz, HFRCO, 3.0 V) the graph shows about 242 uA. The data sheet indicated for this case 200 uA (typ.) and 240 uA (max). Thus, the graph value is outside the typical range. It is above the data sheet value – in this case, 20% higher than the typical value!
Question 4: Can the energy demand be estimated? Can a temperature profile be used without complex hardware setups and investigations?
We still focus our investigations on MCU/SoC devices. The current consumption of semiconductors, in particular with the latest high-performance semiconductor processes, is very dependent on the chip (or die) temperature. While the internal temperature in high-performance processors and high-performance applications is constantly above environment temperature, this is not the case with energy-saving MCU/SoCs. In energy-saving MCU/SoCs, the environment temperature is important for the application life time. At “high” temperature (e.g. 85°C/185°F) the temperature change of only a few degrees causes significant difference in the energy consumption. You only get precise data in a benchmark if you measure in a temperature chamber at constant temperature. A data source which illustrates this quite well is the Atmel-42385J-SAM L21_Datasheet_Complete-06/2016., page 1189. The current consumption values, shown over temperature, are measured under following operating conditions:
• VDDIN = 3.3 V (values left side of curve) and 1.8 V (right of the curve)
• ULPVERG LPEFF enabled
• RTC running on external 32 KHz crystal
• BOD33 is disabled
For the illustration in figure 9, the data were taken from the data sheet.

[Figure 9 | In Backup Sleep-Mode; the amount in RTC-Mode is low at 20° Celsius but significant at 85°; the consumed energy is higher by a factor of 5. Source: Atmel-42385J-SAM L21_Datasheet_Complete-06/2016, page 1189]
Based on data in figure 6a/b, the energy demand in run mode and sleep mode (or RTC mode) is roughly the same. The energy demand in sleep mode would be dominant as part of the entire energy consumption. E.g., in battery operation, the life time of an application will be shortened at 85°C.
In real life, most applications get exposed to temperature changes and operate at non-constant temperature. Minimum two conditions are necessary to cope with the above:
First, the data sheet must include typical data as well as max data for currents over different temperatures, or current consumption curves over temperature should be included.
Second, the user needs a relatively precise temperature profile that is relevant over the lifetime of the application. This is under control of the user, who can or will assure the precision of the profile anyway for quality reasons.
We only asked four possible questions. The evaluation confirmed that an application lifetime calculation, e.g. battery supplied, cannot be done without further support from suppliers. The well-known “try and error” formula doesn’t make you friends in quality departments.
Next up: The impact of operating temperature on energy consumption.