
Energy consumption in modern microcontroller systems, part 1: A benchmark for ultra-low-power
September 15, 2017
Story

When it comes to energy consumption comparisons of MCU/SoC systems, is one benchmark enough or do we need a parametric benchmark?
An important factor in the selection, market positioning, and success of a product is the energy consumption of the entire system. However, traditional approaches for expressing efficiency in microampere (uA) or microwatt per megahertz (uW/MHz) aren’t sufficient anymore. Energy storage systems store neither uA nor uW, but Joules.
Therefore, comparing the energy consumption of microcontroller (MCU) and system on chip (SoC) devices has become the prime focus of users. But is one benchmark enough to select an MCU, MCU family, or MCU manufacturer for an upcoming product design? Are public datasheets enough?
This four-part series seeks to examine these questions using EEMBC benchmarks.
- Part 1: A benchmark for ultra-low-power: The ULPBench-Core Profile
- Part 2: The ULPBench-Core Profile, EEMBC documents, and MCU datasheets
- Part 3: The impact of operating temperature on energy consumption
- Part 4: MCU datasheets: Operation modes, control bits, registers, current, and mode transfer parameters
The conclusion over the last 20 years in the processor market has been that a low current in operating mode[1] and sleep mode[2], as well as shorter operating cycles, leads to energy savings. This is generally applicable, but how does that benefit a customer? Can products really be compared based on these general conclusions?
Benchmarks provide a comparison of different MCUs/SoCs and manufacturing lines using unified definitions and rubrics, as well as standardized execution code. Their goal is to provide transparency and reproducibility, which are enabled by predetermined test vectors, test processes, and test software and hardware. All benchmark data should be made publicly available.
A good benchmark test relies on a single software package that can be executed on a range of 8-, 16- and 32-bit MCUs and SoCs. For fair comparison, the code must be the same regardless of the processor architecture, though the choice of benchmarking software can have a profound impact on energy consumption (Figure 1).
 Figure 1. Current consumption readings from benchmark tests can be much higher than datasheet parameters.
In this article, we assume that benchmark results, data sheets, and other documents enable a correct estimation of energy consumption over the life of a low-power system.
Clarification of terms
In digital domains, current consumption can be sub-divided in two basic categories.
- Dynamic current consumption is used for the execution of functions.
- Static current consumption used for the time a system is in idle or sleep mode wherein no function are executed.
Almost all low power MCUs are presently equipped with analog peripherals. These could be integrated oscillators, voltage supervisors, and power-up circuitry, or comparators, amplifiers, analog-to-digital and digital-to-analog converters (ADCs/DACs), etc.
These peripherals have relatively high static current demand in both sleep and operating modes. For the purposes of this article, the term "static" (energy or current) will include frequency-independent consumption data and current losses, (for example, from leakage). Traditionally, the term “static” consumption has applied to energy consumption in digital domains during operation, and excludes other forms of energy and current consumption, such as leakage current.
The EEMBC ULPBench-CoreProfile benchmark [3]
The Embedded Microprocessor Benchmark Consortium's (EEMBC's) ULPBench-CoreProfile (ULPBench-CP) benchmark provides a good preliminary method and framework for reliably measuring energy efficiency, independent of processor datasheets. The ULPBench-CP aims to verify energy efficiency for products with extended energy requirements or limited available source energy (such as battery-powered IoT devices). It also targets energy harvesting systems that spend most of their operational life in idle sleep mode. Here, standby current is important, as MCU/SoC systems can wake up periodically or asynchronously.
Most MCUs and SoCs are able to run the ULPBench benchmark (even next-generation processors). This allows vendors to provide comparative data users, and, in principle, can allow designers to verify their own workloads on multiple processing solutions under the same conditions.
As a base, the ULPBench-CP benchmark test assumes a load from a lithium coin cell and an average operating time of four years. Execution of the ULPBench-CP software "workload" begins in a processor's operating mode, followed by a second phase in real-time mode. The “workload” is portable and runs on 8-, 16-, und 32-bit MCU/SoCs. The software processes energy consumption information, illustrates it, and delivers basic benchmark data.
ULPBench run rules
A requirement of the ULPBench is hardware and software portability across components that are needed for the benchmark to execute properly. EEMBC provides example code for integrating these components in the ULPBench-CP benchmark test, while other functions such as ADCs, operational amplifiers, etc. can be left unpowered. However, I/O signs must be available.
The target processor board must be powered by EEMBC's EnergyMonitor hardware for valid results. The temperature of the test environment must be higher than 21 °C (70 °F), and the power supply set to 3 V during the benchmark run.
The test period (for example, generated by the wake-up timer) is one second. A 32 KHz crystal oscillator with a precision of 50 ppm is used as the timing reference for the ULPBench-CP. If a crystal oscillator isn't used, the designer must explain how to calibrate whatever timer is used. This is a requirement for the EEMBC Certification Lab to be able to reproduce results.
It's important to note that changing the test period could have serious impact on the results, and will not be accepted under the ULPBench-CP's transparency requirement.
The final bin image and source code must be uploaded to an EEMBC web interface so that benchmark results can be certified.
EnergyMonitor hardware – Why only a 3 V power supply?
The ULPBench-CP defines that the supply voltage for the first phase of the benchmark must be set to 3 V. This is due to the fact that MCUs and SoCs consume less energy at lower supply voltages, so the smallest common denominator supply voltage was selected for benchmark comparison. As an important target of the ULPBench is battery-powered applications, this helps incorporate data for devices that will run on lithium ion batteries:
- Some start at 3.3 V and operate down to 2.7 V
- A few start at 3.0 V and run along this plateau during the discharge phase
- Two alkaline-batteries give a nominal voltage of 3 V
The EEMBC benchmark team is investigating adding another phase of the ULPBench-CP test to allow different voltages, though there is no common view on what that should be. Published indicate a wide variation in the lowest supply voltages of MCU/SoC product families vary widely (see [4]).
Another phase being considered in the development of the benchmark is testing of at least one analog module. A large number of MCUs/SoCs have analog modules that cannot run (or are limited) at 2.2 V. Reducing the supply voltage below a certain level would seem attractive, but could also confuse the user: “Which benchmark value is right for me?”
Why is the environmental temperature defined at 21 °C?
Here, there are two aspects to consider.
First, the semiconductor processes of today and the near future suffer from substantial energy loss even when they aren't running code (also called "leakage current"). These currents often depend on temperature, and can increase rapidly at given temperatures. If temperature is too high while running the benchmark (even a few degrees off the 21 °C (70 °F) target, it could have a significant impact on benchmark results. This makes accurate comparison and reproducibility much more difficult.
The challenge of temperature stability during benchmark execution is illustrated in Figure 2. The current/energy consumption rises steadily from 0 °C to 50 °C, but increases the same amount between 80 °C to 85 °C. In other words, one-tenth the temperature change has the same energetic effect.
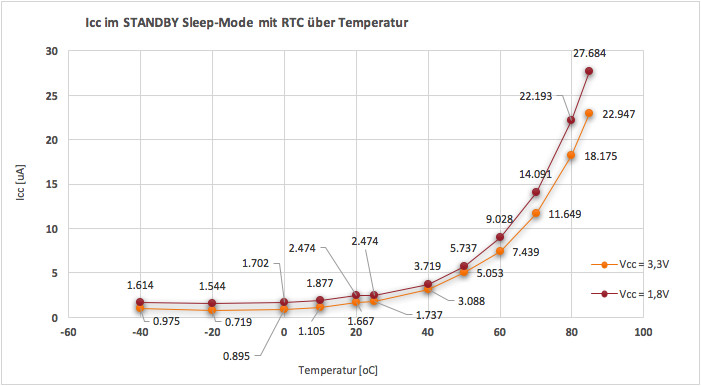
Figure 2. While energy consumption in sleep mode is relatively small at 20 °C, it is much higher at 85 °C (14x higher). Source [5]: Atmel-42385J-SAM L21_Datasheet_Complete-06/2016, Page 1188.
Another challenge for precise benchmark measurements at high temperatures would be to get all tested MCUs and SoCs to the same stable, predetermined temperature. Whether the MCU/SoC is running on a standardized PCB with the same parts in a temperature chamber is difficult to verify.
The temperature of an application should yield temperature profile/cycle information that and the energy consumption will vary accordingly. More of this later…
The EnergyMonitor hardware – Why not conventional measurement equipment?
The EnergyMonitor test board from EEMBC has a wide current measurement range and a low dynamic internal impedance. A conventional current measurement system using a sense resistor hardly achieves usable results.
The Energy Monitor supplies energy to the load out of a capacitor and measures the recharge cycles. This results in a nearly ideal energy source, and a measurement system that is tolerant of current peaks. The device can also measure energy consumption in short code execution situations, such as interrupt event handling (Figure 3, 4).
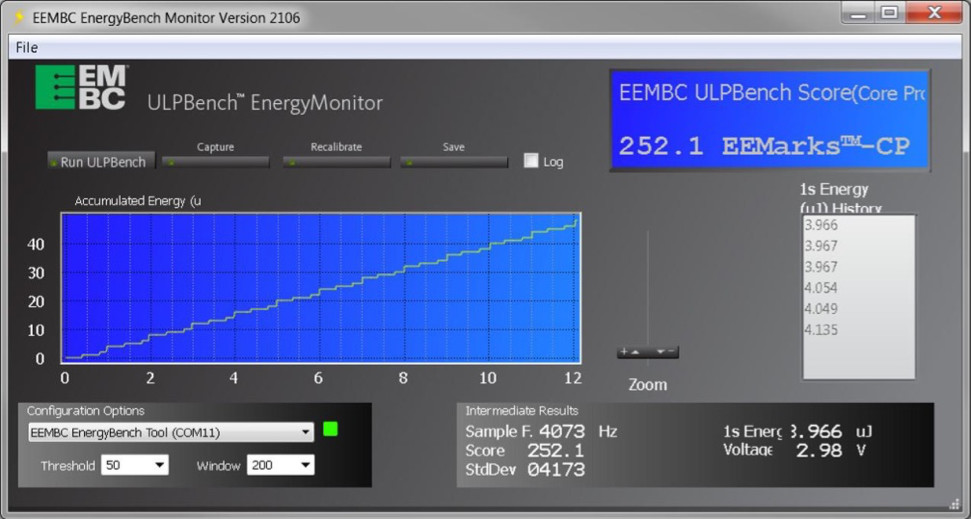
 Figure 4. The graph shows energy over time, too. Only one energy packet is shown. Source [7]: Texas Instruments Slideplayer.
Another advantage is the intensive use of customer-defined energy modes that support power gating in modern processors. The EnergyMonitor sufficiently covers internal device capacity charge and discharge processes, which allows the tool to be used early in the development of energy efficient products.
More important, however, the EnergyMonitor is much lower cost than conventional equipment (see[3]). EnergyMonitor has also been designed to support future ULPBench phases with periods less than one second.
Conclusion
The current ULPBench-CP benchmark provides a baseline for estimating power consumption, making statements like "short run time at small current" and datasheet parameters like µA/MHz unreliable metrics of the past. Users can now request benchmarks such as the ULPBench-CP, or use the tool to measure data themselves.
Part two of this series will check benchmark data against product documents and datasheets to verify their accuracy.
Can energy consumption be determined accurately from MCU descriptions and datasheets to enable the longest operating time of your system?
Horst Diewald is currently co-owner of ProJoule GmbH, where he is responsible for defining IP for next-generation ultra-low-energy programmable systems. He was previously a system architect and manager for ultra-low power 16-bit RISC MSP430 MCUs. Horst was also chairman of the ultra-low power benchmark working group within EEMBC when the ULPBench-CoreProfile was released.
Uwe Mengelkamp has managed the marketing and application organization for the ultra-low power 16-bit RISC MSP430 MCU at Texas Instruments. Later on Uwe developed the portable power market as business unit manager. Both roles focused on the maximum application throughput per joule of energy invested.
ProJoule GmbH
projoule.com
References:
1. Frank Riemenschneider, Weka Verlag, "Prozessor-Benchmarks – wer manipuliert sie am Besten?,“ Elektonik und Design, 2013.
2. Frank Riemenschneider, Weka Verlag, Design und Elektronik, „Ultra-Low-Power-Mikrocontroller Benchmark ULPBench entzaubert,“ 2016.
3. "Embedded Microprocessor Benchmark Consortium,“ [Online]. Available: http://www.eembc.org.
4. Frank Riemenschneider, "Benchmark - ULPBench debunked,“ Design&Elektronik, Oktober 2016.
5. Atmel (R), "Atmel-42385J-SAM L21_Datasheet_Complete-06/2016,“ 2016.
6. Analog Devices (R), "Analog Devices AN-1402, Rev0: Initial Version“.
7. Texas Instruments Inc., "Unbekannt,“ (http://slideplayer.com/slide/5873902/).


