
Debugging at the hardware/software interface
June 01, 2012
Story

As the line between hardware and software continues to blur, debugging at the hardware/software becomes a necessity for delivering quality systems and...
While design issues at the hardware/software interface have been discussed for the better part of a decade, increased software content in today’s application-driven designs has given these issues – specifically the dependency of software on hardware and efficient partitioning – new urgency. In the past, software developers performed their debugging tasks in a hardware-independent, “peripherally blind” fashion using embedded software debuggers connected to prototype boards. This offered great insight into the processor, but little to no information about the surrounding peripherals and on-chip interconnect structures. In contrast, hardware developers have focused on lower-level effects within the registers and interconnection of Systems-on-Chip (SoCs), which are growing more and more complex every year.
When considering debug challenges, on-chip and in-system effects must be evaluated. On-chip debug needs to happen during the development phase to make sure the chip itself works correctly. In-system effects relate to how the chip behaves in its environment. Debugging in-system effects requires either complex modeling of the environment if the effects are to be considered during chip development, or control of the actual environment once the chip is available.
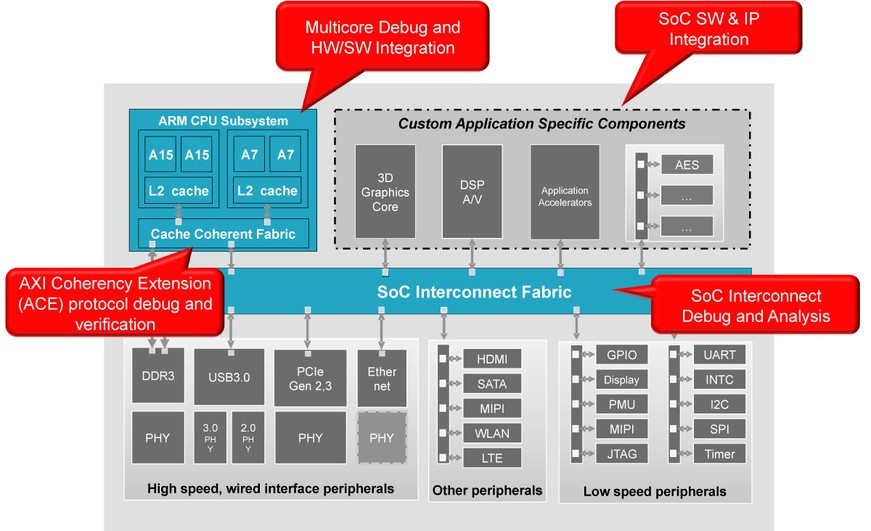
Figure 1 shows a typical ARM core-based SoC with a processor subsystem containing various processors linked by a coherent fabric connection to the rest of the chip. The SoC also contains custom application-specific components for 3D graphics, digital signal processing, dedicated application-specific hardware accelerators, low-speed peripherals, and high-speed interfaces. Debug challenges include debugging multiple cores in lockstep, making sure IP block integration works correctly, debugging protocols like the AMBA 4 AXI Coherency Extensions (ACE) protocol, and debugging the overall chip interconnect.
|
|
In contrast, Figure 2 shows this same SoC in its system context. Connections between the SoCs and the actual system peripherals are established on the PCB and are often based on standards like DigRF, MIPI, and USB. Now the debug challenges shift from the on-chip areas to how the chip behaves in its environment. For instance, are the frames generated by the graphics engine correctly displayed by the external display? Various off-chip and in-system effects need to be considered in tandem with on-chip effects, as they often drive graphics content and control.
|
|

Approaches to hardware/software integration and debug
During the development flow, design teams use several techniques that enable software debug and hardware/software integration.
Once all the chips are available and integrated, the hardware team will typically build a limited number of prototyping boards so the software developers can begin bringing up their code on the device. After a product is released and it proliferates, these prototype boards are often referred to as development kits. They run at real-time speed and are fully accurate. Debuggers are connected to these boards via a JTAG (boundary scan) interface. That type of software debug is very common and well understood but has its challenges, as access to the depths of hardware is limited by the level of implemented on-chip instrumentation.
FPGA-based prototypes of the chips that are to be integrated onto the board can be available several months prior to silicon. These prototypes run in the tens of MHz range, are hardware-accurate, and are often only feasible to use after stable Register Transfer Language (RTL) code is available. They allow limited debug capabilities. Connections to software debuggers are normally established via JTAG, but designers can enhance the RTL with debug information to enable hardware/software debug and analysis. Connecting the chip to the environment is possible depending on the prototype; speed rate adapters often need to be used, or the speed of the environment needs to be reduced to match the prototype speed.
Hardware emulators are available even earlier in the design flow, and they execute the chip under development – or subsets of it – in the MHz speed range. They offer fast bring-up (compared to FPGA-based prototyping, which requires more modification of the code implementing the hardware) and much better hardware/software debug because a significant portion of the hardware emulator is dedicated to debug and control of the design. However, the size and price point of today’s emulators limit their ability to be replicated to large numbers of software developers.
RTL simulation is the first execution environment in which accurate hardware and software can meet. It offers excellent hardware debug capabilities, but because it runs in the KHz range, its applicability for software development and hardware/software integration is very limited. RTL is focused on hardware verification and has traditionally been used only for very low-level, bare-metal software development. Given the complexity of modern on- and off-chip interfaces, commercial verification IP (which provides predefined test patterns to check interface correctness) can be used on-chip and within the system.
Using less accurate, abstracted hardware models, virtual chip platforms under development can run at-speed and are sometimes available 9-12 months prior to silicon. They offer excellent software debug capabilities using standard interfaces like GNU Debugger (GDB) and Cycle-Accurate Debug Interface (CADI) to connect software debuggers to virtualized hardware. The same software debuggers can be used later at the board level. Depending on modeling efforts, the full chip and its environment can be made available for advanced hardware/software debug both on-chip and within the system.
Finally, Software Development Kits (SDKs) are often the earliest available development platform. SDKs like the Apple iPhone SDK or the Android SDK enable many software developers to write their code for hardware that is very abstracted and, as such, cannot be debugged. Code developed on an SDK often needs to be recompiled to run on an actual device, in contrast to virtual prototypes and the other engines mentioned earlier, which load .elf files and run the same binary code that is later executed on the hardware target.
Debugging across the landscape of execution engines
Electronics manufacturers are increasingly distributing software across multiple cores to keep within power envelopes for complex designs. As a result, multicore debug has become a bigger challenge. Fully synchronized heterogeneous software debug for multicore designs is ideal for setting break points in all software components and the hardware itself, which then allows inspection of states, the stack, variables in the software, and registers in the hardware.
Using prototype boards, this is difficult if not impossible. If a break point triggers for the software of one processor and causes it to stop, all other processors continue to execute, changing the state of the environment in which the break point happened. In contrast, with a virtual prototype, all the participating elements – that is, all processors and hardware modules – can be stopped exactly when the break point occurred, thus allowing for efficient hardware/software debug.
In addition, when developers work on actual hardware or with older generations of virtual prototypes, they see a variety of unsynchronized debugger windows. Modern virtual prototypes allow users to efficiently integrate processor models from different vendors via abstraction layers that enable fully synchronized debug and analysis in a single, uniform environment.
Another effect that is difficult to analyze on the actual development board occurs when software has to be stopped based on conditions created by the state hardware is in. In the world of emulators, RTL simulators, and virtual prototypes, hardware debug is advanced, and both hardware and software can be efficiently halted based on break points representing the state or state transition within the hardware – like a specific counter value being reached or a specific transaction sent over a bus.
Whenever software-based hardware execution is involved, software debug can also be efficiently synchronized with a mix of different hardware abstraction levels. This is valuable at the beginning of a derivative project, for which new hardware components are available as highly abstracted models at the transaction level and not yet as hardware implemented at the RTL.
Gaining full view of hardware/software
The complexity of modern software and its dependency on the hardware upon which it is executing have made it unfeasible to delay debugging and hardware/software integration until all the chips are available and integrated onto the PCB. Several execution engines are available to chip and system development teams, but the capability to develop and debug software varies greatly among these engines. Figure 3 shows the previously introduced chip and board combined with engines to execute the chip under development as well as connections to hardware/software debug.
|
|
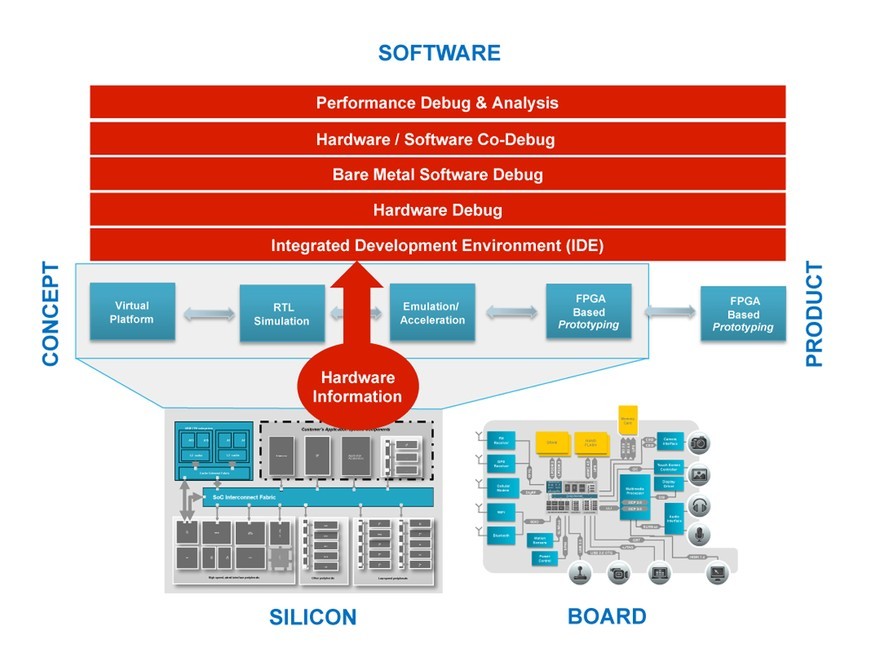
Debug has several layers, often built on Integrated Development Environments (IDEs) like Eclipse. Users need to debug the actual hardware, the bare-metal software execution outside of operating systems, and the hardware and software in combination, as well as the performance of the overall system.
With the hybrid combination of different engines and a new generation of software debuggers, the industry is approaching an era in which software developers can get a complete programmer’s view of the software and hardware much earlier in the design cycle than they ever could before.
Cadence Design Systems 408-348-7025 [email protected] [email protected] [email protected] [email protected] www.cadence.com
Follow: Twitter Facebook LinkedIn YouTube


